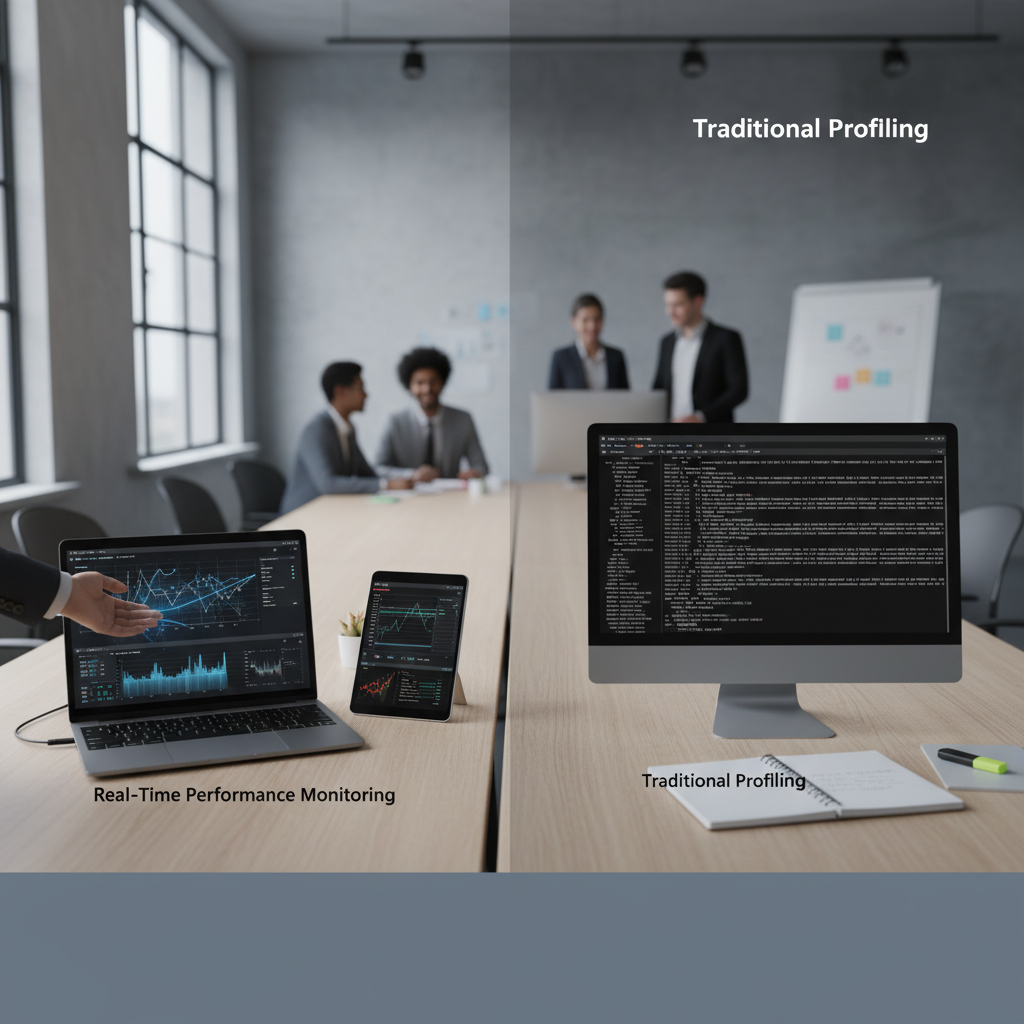
Real-Time Performance Monitoring vs Traditional Profiling
May 18, 2026 · 13 min read
TL;DR — The Bottom Line
Real-time performance monitoring vs traditional profiling is not an either/or debate — it's a question of when each tool earns its keep. Real-time monitoring gives you fleet-wide, continuous visibility and alerts, while traditional profiling delivers deep, code-level diagnostics for targeted investigations. In 2026, the smartest B2B SaaS engineering teams layer both approaches, increasingly bridged by continuous profiling, to achieve observability that is both broad and deep. Read on to understand exactly how each works, where each falls short, and how to build a strategy that combines them effectively.
Quick Facts
- Alert reduction: Teams adopting intelligent, context-rich monitoring report up to 80–90% fewer noisy alerts compared to naive real-time setups
- Incident resolution: Moving from raw real-time monitoring to "useful monitoring" cuts incident resolution time by up to 60%
- Revenue impact: Research suggests companies using real-time operational data saw 62% faster revenue growth vs. slower data-driven peers
- Traditional profiler overhead: Classic profilers can add 10–100% CPU overhead, making continuous production use impractical
- Continuous profiling overhead: Modern continuous profilers typically operate at less than 1–3% CPU overhead, enabling always-on production use
- OpenTelemetry signal status: Profiling is actively being standardized as the "fourth signal" alongside metrics, logs, and traces
Why the Real-Time Performance Monitoring vs Traditional Profiling Debate Still Matters
If you have ever sat in a post-incident review wondering whether your alerting system was actually useful, or spent three hours with a profiler attached to a staging service only to find the issue was production-only behavior, you already understand why the real-time performance monitoring vs traditional profiling conversation matters deeply to modern software teams.
The stakes are higher than ever for B2B SaaS developers. Your customers have SLAs, your infrastructure bills scale with inefficiency, and your on-call engineers have limited patience for alert storms and inconclusive flame graphs. Getting the balance right between monitoring and profiling is not just an engineering preference — it is a business-critical decision that affects revenue, reliability, and developer experience.
In this guide, we break down exactly what differentiates real-time performance monitoring vs traditional profiling, where each approach shines and where it fails, what continuous profiling adds to the equation, and how to build a layered strategy that gives your team the visibility it actually needs.
What Is Real-Time Performance Monitoring?
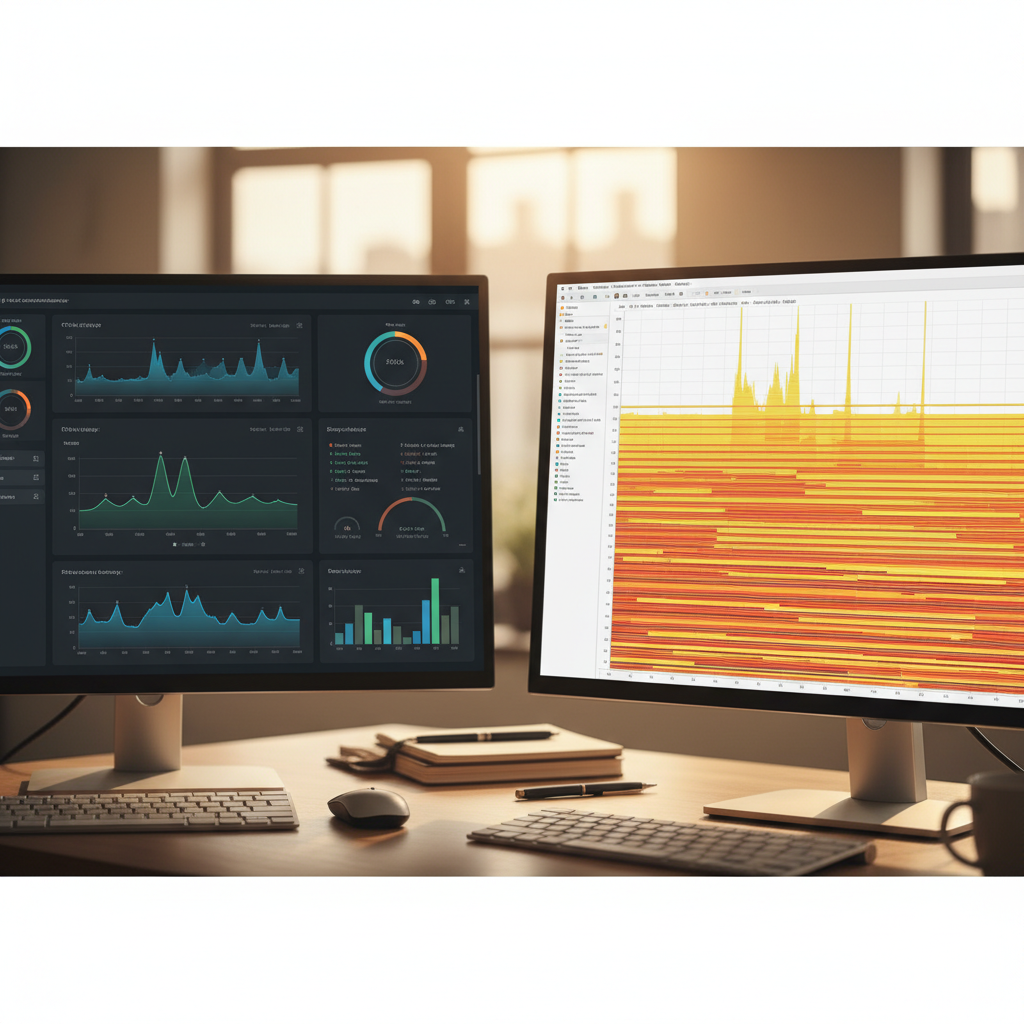
Real-time performance monitoring refers to systems that ingest and analyze telemetry from live infrastructure and applications continuously, typically with latency measured in seconds or milliseconds. Think platforms like Datadog, New Relic, Prometheus-based stacks, and cloud-native APM tools. These systems are your observability layer — the instrumentation that tells you whether your services are healthy right now.
The core data types collected include:
- System metrics: CPU utilization, memory consumption, disk I/O, network throughput
- Application metrics: Request latency (p50, p95, p99), error rates, request throughput, queue depths
- Business metrics: Active sessions, checkout completions, API call volumes
- Distributed traces: End-to-end request paths across microservices
- Logs: Structured event records tied to specific operations
The power of real-time performance monitoring lies in its breadth and continuity. You are watching every service, every region, and every customer-facing endpoint simultaneously, all the time. When a latency spike begins, your SLO alert fires within seconds. When error rates climb after a deploy, you know before most users notice.
For B2B SaaS teams managing distributed microservices architectures, this fleet-wide visibility is not optional — it is foundational. Understanding how to optimize cloud application performance at scale requires exactly this kind of continuous, ambient awareness of system behavior.
Not exactly. APM is a broader category that often includes real-time monitoring, distributed tracing, and sometimes profiling. Real-time performance monitoring specifically refers to the continuous collection and alerting on live telemetry. Modern APM platforms bundle monitoring with additional diagnostic capabilities, but the monitoring layer itself is distinct from deep code-level analysis.
What Is Traditional Profiling — and Where Does It Still Win?
Traditional profiling is a fundamentally different mode of investigation. Rather than watching a broad set of metrics continuously, a profiler attaches to a single running process and captures detailed data about exactly what that process is doing at the code level: which functions are consuming CPU cycles, how memory is being allocated and freed, where goroutines or threads are blocking, and how long individual method calls take.
Profilers come in several flavors:
- CPU profilers: Sample the call stack at regular intervals to identify hot code paths
- Memory profilers: Track heap allocations and identify sources of garbage collection pressure or memory leaks
- Concurrency profilers: Detect thread contention, lock contention, and deadlock-prone patterns
- I/O profilers: Measure time spent in disk and network operations at a granular level
The result is typically a flame graph — a hierarchical visualization of where time or memory is being spent, stackable from the OS kernel up through your application code. These visuals are extraordinarily useful for pinpointing the exact function or library call that is causing a performance regression.
Where traditional profiling genuinely excels:
- Deep diagnosis: When you know something is slow but your monitoring tells you nothing about why, a profiler shows you exactly which lines of code are responsible
- Memory leak investigation: Profilers can trace allocation chains that no dashboard metric can surface
- Pre-release optimization: Profiling in development or staging before shipping catches regressions cheaply
- Algorithm validation: Confirming that a refactored algorithm actually reduces CPU consumption as expected
The critical limitation: traditional profilers carry significant overhead — often 10% to 100% additional CPU load depending on the technique. This makes leaving them running in production impractical for most workloads. They are inherently a short-lived, targeted diagnostic tool, not an always-on observability mechanism.
Real-Time Performance Monitoring vs Traditional Profiling: A Side-by-Side Comparison
Understanding the structural differences between these two approaches is essential before deciding how to combine them. The table below captures the most important dimensions developers should consider when evaluating real-time performance monitoring vs traditional profiling for their stack.
| Dimension | Real-Time Monitoring | Traditional Profiling |
|---|---|---|
| Scope | Entire fleet, all services | Single process or service |
| Duration | Continuous, 24/7 | Short-lived, ad hoc |
| Overhead | Low (1–5% typical) | High (10–100% possible) |
| Data granularity | Metric/trace/log level | Function/stack level |
| Answers | What is happening and when | Why it is happening at the code level |
| Production-safe | Yes | Usually no (with exceptions) |
| Best for | Alerting, SLOs, health trends | Root-cause diagnosis, optimization |
| Tooling examples | Datadog, Prometheus, New Relic | perf, py-spy, async-profiler, VisualVM |
This comparison makes clear that real-time performance monitoring vs traditional profiling is not really a competition — it is a spectrum. The question is not which one to use, but how to integrate both into a coherent workflow so that your monitoring layer surfaces the signal that triggers targeted profiling investigation.
Reach for a traditional profiler when your monitoring alerts you to a problem but the available telemetry does not explain the root cause. If latency is elevated and your traces show the bottleneck is in a specific service but not which code path, it is time to profile. Similarly, if memory is climbing steadily and you cannot attribute it to a known cause from metrics alone, a memory profiler will surface the allocation chain responsible. Monitoring surfaces the symptom; profiling identifies the diagnosis.
The Rise of Continuous Profiling: Bridging the Gap
The most significant development in the real-time performance monitoring vs traditional profiling landscape over the past two years is the maturation of continuous profiling as a practical, production-safe discipline.
Continuous profiling borrows the code-level depth of traditional profiling but redesigns the collection mechanism to operate at extremely low overhead — typically under 1–3% CPU — making it safe to run 24/7 across production workloads. Platforms in this space (including specialized vendors and tools like Pyroscope, now part of Grafana) collect sampled stack traces continuously, store them as time-series data, and allow you to correlate profiling data with the metrics, logs, and traces your monitoring platform already collects.
The practical implications are significant:
- You can see code-level behavior during incidents in production, not just in controlled staging environments
- You can compare profiling data before and after a deployment to confirm whether a change improved or degraded performance
- You can surface optimization opportunities proactively — identifying expensive code paths that never triggered an alert but are silently burning compute budget
OpenTelemetry is actively working to standardize profiling as the "fourth telemetry signal" alongside metrics, logs, and traces. This means the tooling ecosystem is converging toward unified instrumentation that captures all four signal types from a single SDK, dramatically reducing the overhead of operating separate monitoring and profiling stacks.
The connection between continuous profiling and cost efficiency is direct. Inefficient code paths that run continuously in production accumulate real infrastructure cost — and profiling is the only tool that can quantify exactly which functions are responsible. This relationship between code quality and production costs is explored in depth in our analysis of the impact of inefficient code on production costs.
The "Useful Monitoring" Shift: Beyond Raw Real-Time Data
A critical evolution in how engineering teams think about real-time performance monitoring vs traditional profiling is the move away from raw real-time alerting toward what practitioners increasingly call "useful monitoring." The distinction matters enormously for team productivity and system understanding.
Naive real-time monitoring implementations — dashboards full of raw metrics with static threshold alerts — create several well-documented problems:
- Alert fatigue: Teams that alert on every transient CPU spike or brief latency excursion quickly learn to ignore their pagers. Studies have shown that poorly configured monitoring can generate 80–90% more alerts than necessary, most of them noise.
- Context poverty: A dashboard showing "CPU is at 92%" is almost useless without correlated logs, relevant traces, recent deployment markers, and historical baselines to distinguish a real incident from a routine batch job.
- Symptom chasing: Without code-level context from profiling, engineers investigating monitoring alerts spend hours eliminating hypotheses rather than finding root causes.
"Useful monitoring" addresses these gaps through:
- Adaptive thresholds: Alerting based on anomaly detection against historical patterns rather than static cutoffs
- Correlated signals: Linking metric anomalies automatically to relevant logs, traces, and deployment events
- User-experience focus: Prioritizing Real User Monitoring (RUM) metrics like Core Web Vitals alongside infrastructure metrics
- Integrated profiling context: Surfacing relevant flame graph data alongside monitoring alerts when code-level data is available
Research suggests that teams making this shift from raw real-time monitoring to context-rich, intelligent monitoring see incident resolution times drop by up to 60%, with alert volume falling 80–90% as smarter thresholds eliminate noise. These are not marginal improvements — they represent a fundamental change in how effective on-call rotations can be.
"The goal of performance observability is not to collect more data — it is to surface the right data at the right moment with enough context to act decisively. Real-time monitoring and profiling are complementary instruments in that pursuit, not competing alternatives."
Building a Layered Performance Strategy: How to Combine Both Approaches
For B2B SaaS developers evaluating how to structure their real-time performance monitoring vs traditional profiling investment, the answer in 2026 is a layered strategy that treats each tool as complementary rather than competitive.
Here is a practical framework:
- Establish your real-time monitoring foundation. Instrument every service with metrics, distributed traces, and structured logs. Define SLOs for your most critical user journeys (e.g., API latency p99 < 200ms, error rate < 0.1%). Configure adaptive alerting that fires on meaningful SLO burn rate, not raw threshold breaches.
- Add continuous profiling to production. Deploy a low-overhead continuous profiler across your fleet. Configure it to store profiling time-series data that can be queried retrospectively. Even if you never look at a flame graph during normal operations, having this data available during incidents is invaluable.
- Correlate profiling data with your monitoring signals. Use platforms or integrations that link your profiling telemetry to your existing metrics and traces. When an alert fires, engineers should be able to navigate from the monitoring alert directly to the relevant profiling data for that time window and service.
- Maintain traditional profiling capability for deep investigations. Keep profiling tooling available for local development, staging benchmarks, and targeted production sessions when continuous profiling data alone is insufficient. Deep memory leak investigations in particular often benefit from a dedicated profiler session.
- Build a performance regression workflow. Every significant code change should include a comparison of profiling data before and after deployment. Automate flame graph comparisons where possible to catch regressions before they surface as customer-facing incidents.
- Review and iterate on your alerting stack quarterly. Alert configurations decay — new services, traffic pattern shifts, and seasonal behavior all erode the relevance of existing thresholds. Scheduled reviews ensure your real-time monitoring stays useful rather than noisy.
Common Pitfalls When Choosing Between Monitoring and Profiling
Even experienced engineering teams make predictable mistakes when navigating the real-time performance monitoring vs traditional profiling decision. Being aware of these pitfalls can save weeks of frustration.
Pitfall 1: Treating monitoring as a replacement for profiling
Many teams invest heavily in a comprehensive observability platform and assume it covers their performance analysis needs entirely. When incidents occur that monitoring cannot explain, engineers without profiling habits find themselves guessing at root causes or running expensive all-hands debugging sessions. Monitoring and profiling answer different questions — neither substitutes for the other.
Pitfall 2: Only profiling in development and staging
Production behavior routinely differs from staging in ways that matter enormously for performance: real traffic patterns, production data volumes, concurrent user behavior, and infrastructure configuration differences all produce performance characteristics that staging cannot replicate. Teams that restrict profiling to pre-production environments miss the class of performance problems that only manifest under real load.
Pitfall 3: Ignoring the cost dimension of monitoring overhead
Real-time monitoring is not free. The agents, sidecars, and telemetry pipelines that power your observability stack consume CPU and memory, and the data ingestion costs from cloud monitoring platforms can become significant at scale. Teams should audit their instrumentation for redundant or low-value telemetry and prioritize signal quality over raw data volume. This connects directly to broader engineering efficiency practices — the same discipline that optimizing cloud application performance requires.
Pitfall 4: Skipping the correlation layer
Running a real-time monitoring platform and a separate profiling tool without integration between them means engineers must manually correlate two disconnected data sources during high-pressure incident response. This significantly increases mean-time-to-resolution and reduces the practical value of profiling data. Invest in integration — whether through a unified platform or custom tooling — to ensure monitoring alerts and profiling data are navigable together.
Frequently Asked Questions
What is the main difference between real-time performance monitoring and traditional profiling?
Real-time performance monitoring continuously watches your entire service fleet using metrics, traces, and logs, providing fleet-wide visibility and immediate alerting when issues arise. Traditional profiling attaches to a single process for a limited time to capture detailed code-level data — which functions consume CPU, how memory is allocated, where execution blocks. Monitoring tells you what is happening system-wide; profiling tells you why at the code level. Both are necessary for a complete performance engineering practice.
Can you run traditional profiling tools in production safely?
Traditional profilers typically carry too much overhead — often 10% to 100% additional CPU — to run continuously in production without impacting user experience. However, short-duration profiling sessions in production are sometimes feasible during low-traffic windows for targeted investigations. Continuous profiling tools, designed specifically for production use, operate at under 1–3% overhead and are safe for always-on deployment. For most teams, continuous profiling is the preferred approach for production code-level insight.
What is continuous profiling and how does it differ from both real-time monitoring and traditional profiling?
Continuous profiling is a technique that runs a low-overhead profiler continuously in production, capturing sampled stack traces as time-series data. It differs from real-time monitoring in that it captures code-level function-by-function behavior rather than system-level metrics. It differs from traditional profiling in that it is designed for always-on production use rather than short, high-overhead diagnostic sessions. Continuous profiling effectively bridges the gap between the two approaches, giving teams code-level depth with fleet-wide, continuous coverage.
How does real-time performance monitoring vs traditional profiling relate to incident response?
In a typical incident response workflow, real-time monitoring is your early warning system — it detects the problem and alerts the on-call engineer. Traditional or continuous profiling is the diagnostic tool you reach for once monitoring has identified the affected service. The monitoring data narrows the investigation to a specific time window and service; the profiling data surfaces the exact code path responsible. Teams with both layers available consistently resolve incidents faster than those relying on monitoring alone.
Which platforms support both real-time monitoring and profiling in a single tool?
Several full-stack observability platforms are building toward unified monitoring-and-profiling experiences. Grafana Cloud integrates Pyroscope for continuous profiling alongside Prometheus metrics, Loki logs, and Tempo traces. Datadog offers continuous profiler add-ons to its APM suite. Specialized vendors in the continuous profiling space are building integrations with popular monitoring stacks. The OpenTelemetry project is standardizing profiling as a fourth signal alongside metrics, logs, and traces, which will accelerate vendor support across the ecosystem.
Conclusion: The Future Is Unified Observability
The real-time performance monitoring vs traditional profiling debate ultimately resolves to a false dichotomy. In 2026, high-performing B2B SaaS engineering teams do not choose between them — they operate both as complementary layers of a unified observability strategy.
Real-time performance monitoring gives you the continuous, fleet-wide awareness that modern distributed systems demand. Traditional and continuous profiling give you the code-level depth needed to understand why performance problems occur and how to fix them at the source. The gap between these two disciplines is rapidly closing as continuous profiling matures and OpenTelemetry standardizes profiling as a first-class telemetry signal.
The teams that will win on performance in the coming years are those who treat monitoring and profiling not as separate tools managed by separate people, but as an integrated observability practice where each layer informs and enriches the other. When your monitoring alert links directly to the relevant profiling flame graph, root-cause diagnosis stops being a guessing game and becomes a structured, reproducible process.
At JECO, we build tooling for engineering teams who take performance seriously — not just as an operational concern but as a competitive differentiator and a cost lever. If you are ready to move beyond raw dashboards and ad hoc profiling sessions toward a genuinely integrated performance strategy, we would love to show you what that looks like in practice.
Ready to see how JECO approaches unified performance observability? Explore our cloud performance optimization guide or get in touch with our team to discuss your specific stack.