Compare Application Performance Monitoring Solutions for Devs
June 9, 2026 · 13 min read

Choosing the right observability stack has become one of the most consequential engineering decisions of 2026. When you compare application performance monitoring solutions for developers, you're no longer just picking a dashboard — you're committing to a telemetry pipeline, a pricing model, and a developer workflow that will shape how your team ships and debugs software for years.
TL;DR — The Bottom Line
When you compare application performance monitoring solutions for developers in 2026, the decision comes down to four axes: OpenTelemetry support, full-stack signal correlation, pricing predictability, and developer workflow fit. Datadog and New Relic lead on breadth; Coralogix wins on cost control; Sentry dominates code-centric debugging; SigNoz and the Grafana/Prometheus/Jaeger stack appeal to open-source-first teams. There is no single best tool — only the best fit for your data volume, team size, and engineering culture.
Quick Facts
- Dominant standard: OpenTelemetry is now the default instrumentation layer for new APM deployments
- Top pricing models: Per-host, per-ingest-GB, per-seat, and hybrid
- Core APM signals: Traces, metrics, logs, RUM, synthetics, profiling
- Gartner capability groups: DEM, ADTD, and Application Analytics
- Leading SaaS vendor: Datadog, by breadth and correlation depth
- Leading open-source stack: Grafana LGTM + Prometheus + Jaeger
Why It's Harder Than Ever to Compare Application Performance Monitoring Solutions for Developers
A decade ago, APM meant installing an agent on a host and watching CPU graphs. Today, when developers compare application performance monitoring solutions for developers, they evaluate distributed tracing fidelity, log indexing strategies, frontend RUM, mobile crash analytics, security signals, and AI-assisted root cause analysis — often in the same procurement cycle.
The shift is driven by three forces. First, microservices and serverless architectures broke single-host monitoring. Second, OpenTelemetry standardized instrumentation, freeing teams from vendor lock-in. Third, telemetry volumes exploded, making pricing a first-class architectural concern. For B2B SaaS teams at JECO's observability practice, this means platform selection is now a multi-stakeholder decision involving SRE, security, finance, and developer experience leads.
Before you can meaningfully compare application performance monitoring solutions for developers, you need to map your own constraints: telemetry volume per month, cardinality of your metrics, number of services, frontend exposure, compliance scope, and how much operational burden your team can absorb.
The Six Categories Every APM Comparison Should Cover
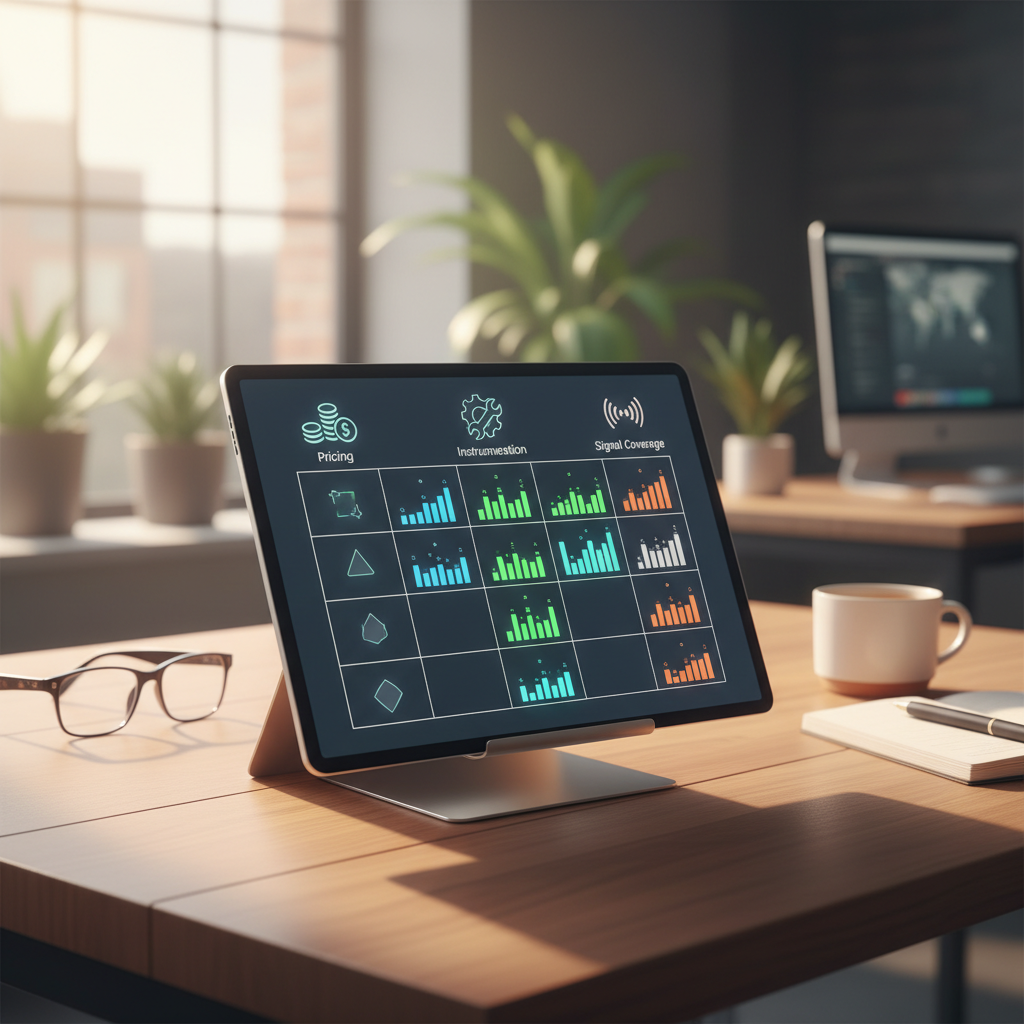
A useful framework when you compare application performance monitoring solutions for developers is to score each candidate across six dimensions rather than just feature checklists.
- Instrumentation model: Proprietary agent, OpenTelemetry-native, or hybrid
- Signal coverage: Traces, metrics, logs, RUM, synthetics, profiling, security
- Correlation depth: How well signals link to one another at query time
- Pricing model: Per-host, per-ingest, per-seat, per-indexed-span
- Developer workflow: Issue-first, dashboard-first, query-first, or notebook-first
- Operational ownership: Fully SaaS, self-hosted, or BYOC (bring your own cloud)
This rubric matters because two tools can both claim "full-stack observability" yet feel radically different in day-to-day use. A developer fixing a 500 error wants different ergonomics than an SRE chasing a tail-latency spike.
Head-to-Head: How to Compare Application Performance Monitoring Solutions for Developers
Below is a practical side-by-side built from current vendor positioning. Use it as a starting point, not a verdict.
| Solution | Best Fit | Pricing Model | Key Strength | Main Tradeoff |
|---|---|---|---|---|
| Datadog | Cloud-native teams wanting one vendor | Per-host APM + per-ingest logs/spans | Mature AI-assisted tracing and security correlation | Costs scale across multiple billing dimensions |
| New Relic | Teams wanting a broad unified UI | Per-seat + per-ingest GB | Bundled APM, infra, browser, mobile, synthetics | Mixed pricing is hard to forecast |
| Coralogix | High-volume, cost-sensitive teams | Per-GB ingest, no host fees, BYO S3 | Cost predictability and data ownership | Less of a single fixed suite than incumbents |
| Sentry | Developers focused on fixing code fast | Per-event tiered | Issue-to-transaction-to-code linkage | Narrower than platform-wide observability |
| SigNoz | OpenTelemetry-first teams | Open core + SaaS tiers | Single ClickHouse backend, OTel-native | Smaller ecosystem than incumbents |
| Grafana + Prometheus + Jaeger | Platform teams building their own stack | Open source + infra cost | Flexibility, composability, no vendor lock-in | Operational ownership is on you |
For most new architectures, yes. OpenTelemetry has become the default instrumentation layer, and choosing a vendor without first-class OTel support locks you into proprietary agents that are increasingly expensive to maintain and migrate away from.
Pricing Models Demystified
Pricing is where most APM evaluations succeed or fail. When you compare application performance monitoring solutions for developers, model the actual bill — not the list price — using realistic telemetry projections.
Per-host pricing
Common with Datadog APM. Predictable if your fleet is stable, painful if you autoscale aggressively or run many small containers. Ephemeral hosts can multiply costs unexpectedly.
Per-ingest-GB pricing
Used by Coralogix and parts of New Relic. Aligns spend with telemetry volume, which is what actually drives infrastructure cost on the vendor side. The risk: noisy logs can blow your budget.
Per-seat pricing
Common for full-platform access (New Relic uses a seat component). Simple to understand, but punishes teams that want broad observability access for every engineer.
Per-event or per-indexed-span pricing
Sentry uses event-based pricing; Datadog charges for indexed spans separately from ingested ones. These models reward sampling and intentional data hygiene.
A practical tactic: build a one-page model that projects 12-month spend at 1x, 3x, and 10x current telemetry volume. The vendor that wins at 1x often loses badly at 10x. Our team at JECO's telemetry cost modeling guide walks through this exercise in detail.
Developer Workflow Fit: The Underrated Decision Factor
When developers compare application performance monitoring solutions for developers, they often over-index on feature lists and under-index on workflow. Yet workflow is what determines whether the tool gets used at 2 a.m. during an incident.
Issue-first workflow (Sentry-style)
The unit of work is an error or regression. Developers land in a stack trace, see the offending commit, and jump to a transaction trace. Best for teams where most performance issues correlate with code changes.
Dashboard-first workflow (Datadog, New Relic)
Engineers start from service overviews and drill into traces and logs. Best for SRE-led organizations with mature runbooks.
Query-first workflow (Grafana, SigNoz)
Engineers write PromQL, LogQL, or ClickHouse SQL directly. Powerful but requires fluency. Best for platform engineering teams.
There's no objectively correct answer. The right question is: which workflow matches how your engineers already think about systems?
How to Compare Application Performance Monitoring Solutions for Developers: A 7-Step Evaluation
- Inventory your telemetry sources. List every service, runtime, frontend, and mobile surface you need to instrument.
- Project 12-month telemetry volume. Estimate logs in GB/day, spans/second, metrics cardinality, and RUM sessions/month.
- Define non-negotiable signals. Decide which of traces, logs, metrics, RUM, synthetics, profiling, and security you truly need on day one.
- Shortlist three vendors. Mix one incumbent, one cost-optimized challenger, and one OpenTelemetry-native option.
- Run a 30-day instrumented bake-off. Send identical telemetry to all three. Measure ingest cost, query latency, and developer satisfaction.
- Model spend at 3x and 10x scale. Confirm the pricing model survives growth.
- Validate exit cost. Confirm your instrumentation (ideally OpenTelemetry) is portable if you need to switch vendors later.
Plan for 30 to 45 days. You need at least one full billing cycle, one production incident, and one feature release to honestly evaluate how a platform performs under real conditions.
Quotable Insights for Engineering Leaders
Two takeaways consistently emerge from teams that have completed rigorous APM comparisons:
"The cheapest APM platform on day one is rarely the cheapest platform at the end of year two — pricing model matters more than list price."
"OpenTelemetry instrumentation is the single best insurance policy against vendor lock-in that an engineering organization can buy."
If your evaluation doesn't surface answers to both of those statements, your shortlist isn't finished. For a deeper walkthrough of structured evaluations, see JECO's APM evaluation framework.
When Each Solution Wins
Choose Datadog if…
You want one vendor for traces, logs, metrics, RUM, and security, you have budget headroom, and you value AI-assisted correlation more than cost predictability.
Choose New Relic if…
You want broad coverage across APM, infrastructure, browser, mobile, and synthetics with a unified UI, and seat-based pricing aligns with your team size.
Choose Coralogix if…
Telemetry volume is your dominant cost driver, you want customer-owned S3 storage, and you're comfortable with a per-GB economic model.
Choose Sentry if…
Your priority is helping developers go from a user-facing error to the offending line of code in seconds, and platform-wide observability is handled elsewhere.
Choose SigNoz if…
You're standardizing on OpenTelemetry, you want a single backend for traces/metrics/logs, and you value the option to self-host.
Choose Grafana + Prometheus + Jaeger if…
You have a dedicated platform engineering team, you prioritize composability and openness, and you're willing to own the operational burden.
Common Pitfalls When You Compare Application Performance Monitoring Solutions for Developers
Even sophisticated teams make repeatable mistakes during APM evaluations. Avoid these:
- Optimizing for current scale only. If your data volume doubles every six months, project accordingly.
- Ignoring cardinality limits. High-cardinality metrics can silently break dashboards or trigger surprise bills.
- Skipping the frontend. RUM and session replay reveal performance issues backend tracing never will.
- Underestimating training cost. A powerful query language no one uses is a wasted license.
- Failing to plan an exit. If you can't leave a vendor, you can't negotiate with them.
Frequently Asked Questions
What is the best application performance monitoring solution for developers in 2026?
There is no single best APM solution. Datadog leads on breadth and correlation, Sentry leads on code-centric debugging, Coralogix leads on cost control, and SigNoz leads on OpenTelemetry-native architecture. The right choice depends on your telemetry volume, team workflow, and pricing tolerance.
How do I compare application performance monitoring solutions for developers without bias?
Run a 30-to-45-day instrumented bake-off using OpenTelemetry to send identical telemetry to each candidate. Measure ingest cost, query performance, developer satisfaction, and time-to-resolution during at least one real incident.
Is OpenTelemetry replacing proprietary APM agents?
For new deployments, largely yes. OpenTelemetry has become the default instrumentation standard, and most major vendors now accept OTLP natively. Proprietary agents persist mostly for advanced auto-instrumentation features that OTel hasn't fully matched.
What pricing model is best for high-volume telemetry?
Per-GB ingestion pricing, like Coralogix offers, tends to scale most predictably for high-volume teams because it aligns cost with the actual driver of vendor infrastructure spend. Per-host pricing can become punishing in autoscaling or container-heavy environments.
Can open-source APM stacks really replace commercial platforms?
Yes, technically — Grafana, Prometheus, Loki, Tempo, and Jaeger together cover most APM capabilities. But total cost of ownership including platform engineering time often matches commercial SaaS, so the decision should be made on control and flexibility, not assumed savings.
Conclusion: Make the Comparison That Matches Your Team
The right way to compare application performance monitoring solutions for developers in 2026 is to stop looking for a universal winner and start looking for the platform that fits your telemetry volume, your team's workflow, and your cost model. The vendors in this guide are all credible — they simply optimize for different futures. The most expensive mistake is choosing based on a competitor's success story instead of your own constraints.
Run the seven-step evaluation, model your spend honestly at three scales, and protect your optionality with OpenTelemetry instrumentation. Whether you land on Datadog, Coralogix, Sentry, SigNoz, or a self-managed Grafana stack, the discipline of the comparison matters more than the destination.
Ready to run a structured APM evaluation for your engineering organization? Talk to the team at JECO about a guided vendor bake-off built around your real telemetry and your real workflow.