Compare Application Performance Monitoring Solutions for Devs
June 25, 2026 · 13 min read

TL;DR — The Bottom Line
When you compare application performance monitoring solutions for developers in 2026, the choice comes down to four trade-offs: depth of code-level tracing, breadth of full-stack observability, ease of instrumentation, and total cost at scale. Datadog, Dynatrace, and New Relic dominate the full-stack tier; IBM Instana and Elastic APM win on auto-discovery and openness; LogRocket and Stackify Retrace serve frontend and developer-first niches respectively. The right pick depends on your stack, team size, and whether you optimize for AI-driven root cause or hands-on debugging.
Choosing the right observability stack is one of the highest-leverage decisions an engineering team makes. In this guide we compare application performance monitoring solutions for developers across pricing, instrumentation friction, distributed tracing depth, and real-world developer experience — so you can confidently match a tool to your stack. Whether you ship a Kubernetes-native microservices platform or a Java monolith, the right APM cuts mean-time-to-resolution (MTTR) dramatically and protects revenue-critical user journeys.
Quick Facts
- APM products tracked on G2 in 2026: 89
- Top-rated APM by review score: LogRocket (4.6/5, 2,300+ reviews)
- Highest-volume enterprise APM: Dynatrace (1,300+ reviews, 4.5/5)
- Gartner APM capability buckets: DEM, ADTD, Application Analytics
- Average MTTR reduction with mature APM: 40–70% across reported case studies
- Primary buying trigger in 2026: AI-driven root cause analysis
Why Developers Need to Compare APM Solutions Carefully
Modern applications generate enormous telemetry volumes — a single request can fan out across dozens of microservices, queues, and managed cloud services. The wrong APM choice means either drowning in unactionable noise or paying enterprise-scale ingest fees for data you can't query effectively. When you compare application performance monitoring solutions for developers, you're really comparing how each platform handles three problems: signal extraction, contextual correlation, and developer ergonomics.
Gartner organizes APM capabilities into three buckets that are useful as a comparison scaffold: Digital Experience Monitoring (DEM) covers real-user and synthetic monitoring, Application Discovery Tracing & Diagnostics (ADTD) covers distributed tracing and topology, and Application Analytics (AA) uses ML to correlate performance with business impact. Developers typically feel ADTD and AA most acutely — they're what you reach for when an endpoint slows down at 3 a.m. and you need to know which database query, which service, and which deploy caused it.
AI-driven root cause analysis. Tools like Dynatrace and Datadog Watchdog automatically correlate anomalies across traces, logs, and infrastructure, while lighter tools still rely on manual dashboards and queries. The gap can mean 30+ minutes of incident time per outage.
The Major Players: How to Compare Application Performance Monitoring Solutions for Developers
The 2026 APM market has consolidated into roughly three tiers. Understanding the tier helps narrow the shortlist before you compare features in detail. Our team at JECO's observability practice uses this same framework when advising engineering leaders.
Tier 1: Full-Stack Observability Platforms
- Datadog APM — 4.4/5 on G2, 700+ reviews. Strongest for teams that want one SaaS pane of glass across infrastructure, logs, traces, and RUM. Pricing scales aggressively with host count and custom metrics.
- Dynatrace — 4.5/5, 1,300+ reviews. Leads on AI-driven root cause via its Davis AI engine. Best for complex hybrid and Kubernetes estates where automation outweighs configurability.
- New Relic — 4.4/5, 500+ reviews. User-based pricing model is unusually developer-friendly. Strong frontend-to-backend telemetry unification.
- AppDynamics (Cisco/Splunk) — Enterprise incumbent, particularly strong for Java/.NET business-transaction monitoring in regulated industries.
Tier 2: Open and Auto-Discovery Tools
- Elastic APM — Open-source-friendly, great if you already run the Elastic Stack for logs. Lower ingest costs at scale, but more operational overhead.
- IBM Instana — 4.4/5, 400+ reviews. Differentiates on zero-configuration microservices discovery. Sensors auto-detect services and dependencies without manual instrumentation.
- Splunk APM — Strong choice if Splunk is already your logging standard; OpenTelemetry-native.
Tier 3: Developer-Centric and Focused Tools
- Stackify Retrace — Built for developers at small-to-mid teams. Code-level insights, error tracking, and log management in one affordable package.
- LogRocket — 4.6/5, 2,300+ reviews. Frontend session replay plus observability — invaluable for product teams chasing UX regressions.
- Honeycomb — High-cardinality event store optimized for exploratory debugging of distributed systems.
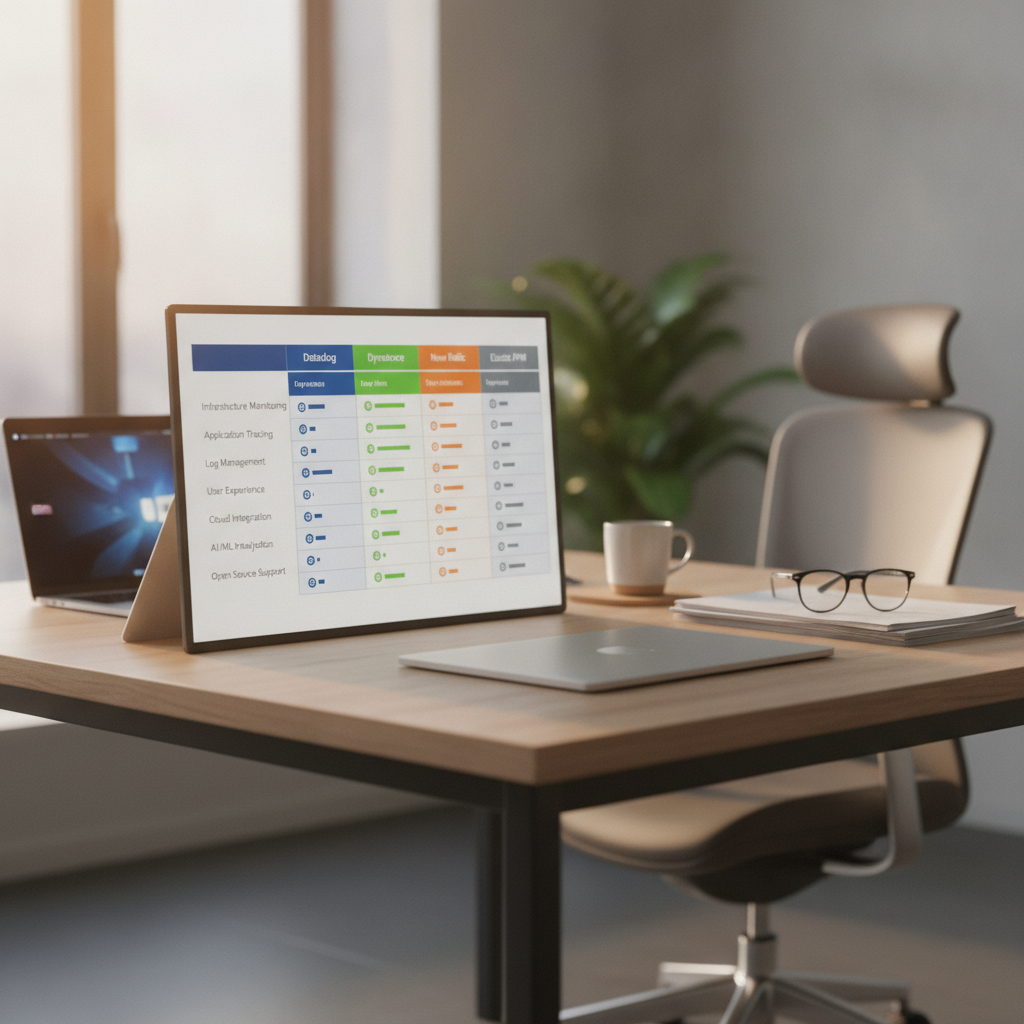
Feature-by-Feature: Compare Application Performance Monitoring Solutions for Developers
Below is a head-to-head matrix on the dimensions that matter most when you compare application performance monitoring solutions for developers in real procurement conversations.
| Tool | Distributed Tracing | AI Root Cause | Instrumentation Effort | Best For |
|---|---|---|---|---|
| Datadog | Excellent | Watchdog (strong) | Medium (agent + libs) | Cloud-native unified platform |
| Dynatrace | Excellent | Davis AI (best-in-class) | Low (OneAgent) | Enterprise hybrid estates |
| New Relic | Excellent | Applied Intelligence | Medium | Frontend + backend balance |
| AppDynamics | Strong (Java/.NET) | Cognition Engine | Medium-High | Regulated enterprises |
| Elastic APM | Good (OTel-native) | Limited | Medium-High (self-host) | Elastic Stack users |
| IBM Instana | Excellent | Strong | Very Low (auto-discovery) | Dynamic microservices |
| Stackify Retrace | Basic | Limited | Low | Small dev teams |
| LogRocket | Frontend-focused | Session-level AI | Low (JS snippet) | Frontend/product teams |
One quotable principle holds across every evaluation we've run: the best APM is the one your developers actually open during incidents — not the one with the longest feature list. A tool with 80% of the capability and 100% of the adoption beats a fully-loaded platform that engineers route around.
Pricing Models: The Hidden Cost When You Compare APM Tools
Pricing is where APM comparisons get treacherous. List prices rarely reflect what you'll actually pay, and the wrong pricing model can punish exactly the architecture you're trying to monitor.
- Host-based (Datadog, AppDynamics): Predictable until you autoscale. A Kubernetes cluster that bursts to 200 nodes will produce a startling bill.
- Ingest-based (Splunk, Elastic): Costs scale with telemetry volume. Excellent for steady workloads, painful for chatty microservices unless you sample aggressively.
- User-based (New Relic): Friendly for telemetry-heavy teams; the trade-off is per-seat economics if every engineer needs access.
- Custom/Enterprise (Dynatrace, AppDynamics): Negotiated annually; expect 30–50% discounts off list but multi-year commitments.
Plan for 1.5–3% of total cloud infrastructure spend for a mature observability stack including APM, logs, and RUM. Teams under that range typically have blind spots; teams above it often have overlapping tools they could consolidate.
OpenTelemetry: The Force Reshaping How We Compare APM Solutions
OpenTelemetry (OTel) has become the de facto instrumentation standard, and it's quietly transforming how developers compare application performance monitoring solutions. With OTel-native instrumentation in your code, you decouple what you collect from where you send it — meaning vendor switching costs collapse from quarters of re-instrumentation work to a config change.
Every Tier 1 vendor now accepts OTel data, but the quality of ingestion varies. Splunk APM, Elastic APM, and Honeycomb are essentially OTel-native. Datadog and New Relic accept OTel but optimize their proprietary agents. Dynatrace's OneAgent still delivers richer signals than OTel alone for deep code profiling. When you build your shortlist, ask each vendor specifically how their OTel support compares to their proprietary instrumentation — the answer reveals their long-term strategy.
How to Compare Application Performance Monitoring Solutions for Developers: A Practical Process
Here's the evaluation playbook our consulting team at JECO uses with engineering clients when they need to compare application performance monitoring solutions for developers under real procurement pressure.
- Define your top 3 incident scenarios. Slow checkout endpoint? Database deadlock? Memory leak in a Node service? Your APM must excel at these — not at theoretical capabilities you'll never use.
- Inventory your stack. Languages, runtimes, message brokers, databases, cloud providers. Each tool has stronger and weaker language agents; AppDynamics shines on Java/.NET, Datadog on Python/Go, LogRocket on JavaScript.
- Set telemetry budgets. Estimate traces/second, log volume, and custom metrics per host. Use those numbers to get true quotes — not list pricing.
- Run a 30-day production pilot. Two vendors, one real workload each. Measure MTTR on actual incidents, not synthetic tests.
- Score on developer experience. Have three engineers independently debug the same staged issue in each tool. Time-to-insight is your truest metric.
- Model 3-year TCO. Include ingest growth, seat expansion, and the engineering time of maintaining the tool itself.
- Negotiate. Every enterprise APM vendor discounts. Multi-year commits typically unlock 25–40% off year-one list.
Stack-Specific Recommendations
Kubernetes-Native Microservices
For dynamic, autoscaling Kubernetes workloads, prioritize tools with strong auto-discovery and topology mapping. IBM Instana and Dynatrace lead here — both detect new pods and services without manual config. Datadog is a strong third with mature Kubernetes integrations.
Java/.NET Monoliths and Enterprise Workloads
AppDynamics remains the gold standard for deep business-transaction monitoring on JVM and CLR runtimes. Dynatrace is the modern alternative if you want more AI automation. New Relic's Java agent is also exceptionally mature.
Modern Frontend (React, Next.js, Vue)
LogRocket for session replay and UX debugging; pair with Datadog RUM or New Relic Browser for performance metrics. Frontend observability is often the most neglected gap when teams compare application performance monitoring solutions for developers.
Polyglot Startups Under 50 Engineers
New Relic (generous free tier, user-based pricing) or Stackify Retrace for smaller teams. Both deliver 80% of enterprise capability at a fraction of the cost. Consider JECO's startup observability roadmap for sequencing investments.
Common Pitfalls When Comparing APM Tools
Even experienced teams stumble in predictable ways. Avoid these when you compare application performance monitoring solutions for developers:
- Evaluating on demos, not data. Vendor demos use curated environments. Your dirty production data will behave differently.
- Ignoring sampling defaults. Many tools sample traces by default, hiding the long-tail issues you most need to see. Always check sample rates and adjust for your error budgets.
- Treating logs, metrics, and traces as separate purchases. The whole value of modern APM is correlation. Buying three best-of-breed tools that don't talk to each other often costs more and delivers less than a unified platform.
- Underestimating the human cost. A tool that requires a dedicated observability engineer to maintain has a much higher real TCO than its license fee suggests.
- Skipping the exit plan. Ask every vendor: how do I export my data and instrumentation if I leave? OTel-native answers indicate confidence; vague answers indicate lock-in.
Frequently Asked Questions
What is the best APM tool for developers in 2026?
There's no single best tool — the right choice depends on stack and team size. For most developer-led teams, New Relic offers the best balance of capability and pricing transparency. Dynatrace leads on AI automation for enterprises, Datadog wins on unified platform breadth, and Stackify Retrace serves smaller dev teams cost-effectively.
How do I compare application performance monitoring solutions for developers without bias?
Run a structured 30-day production pilot with two finalists, measuring MTTR on real incidents, developer time-to-insight on staged debugging exercises, and 3-year TCO including ingest growth. Avoid relying on vendor demos or analyst rankings alone.
Is OpenTelemetry replacing commercial APM tools?
No — OpenTelemetry standardizes instrumentation, but you still need a backend to store, query, and analyze the telemetry. OTel makes commercial APMs more interchangeable, but their analytics, AI, and UX still differentiate them significantly.
How much does enterprise APM typically cost?
Mid-market deployments range from $50K–$250K annually; large enterprise contracts with Dynatrace, Datadog, or AppDynamics commonly exceed $1M ARR. Plan for 1.5–3% of total cloud infrastructure spend as a healthy observability budget.
Can I use multiple APM tools at once?
Yes, and many teams do — for example, LogRocket for frontend session replay alongside Datadog for backend tracing. Just be deliberate about correlation: ensure trace IDs propagate across tools so you can pivot between them during incidents.
Final Recommendations and Next Steps
When you compare application performance monitoring solutions for developers, resist the urge to optimize for feature checklists. The winning tool is the one your engineers reach for at 2 a.m. — the one that surfaces root cause in two clicks, not twelve. For most B2B SaaS teams in 2026, that means a Tier 1 platform (Datadog, Dynatrace, or New Relic) for core APM, augmented with LogRocket or similar for frontend depth, all instrumented with OpenTelemetry to preserve future flexibility.
Whichever direction you take, validate with a real production pilot, score developer experience explicitly, and model TCO over three years — not one. If you'd like help running a structured evaluation across your specific stack, our team at JECO partners with engineering organizations to compare application performance monitoring solutions for developers and deliver vendor-neutral recommendations. Start with a 30-day pilot, measure what matters, and let your developers — not your procurement team — pick the winner.