What Is Technical Analysis in Trading? Beginner Guide
August 10, 2026 · 13 min read
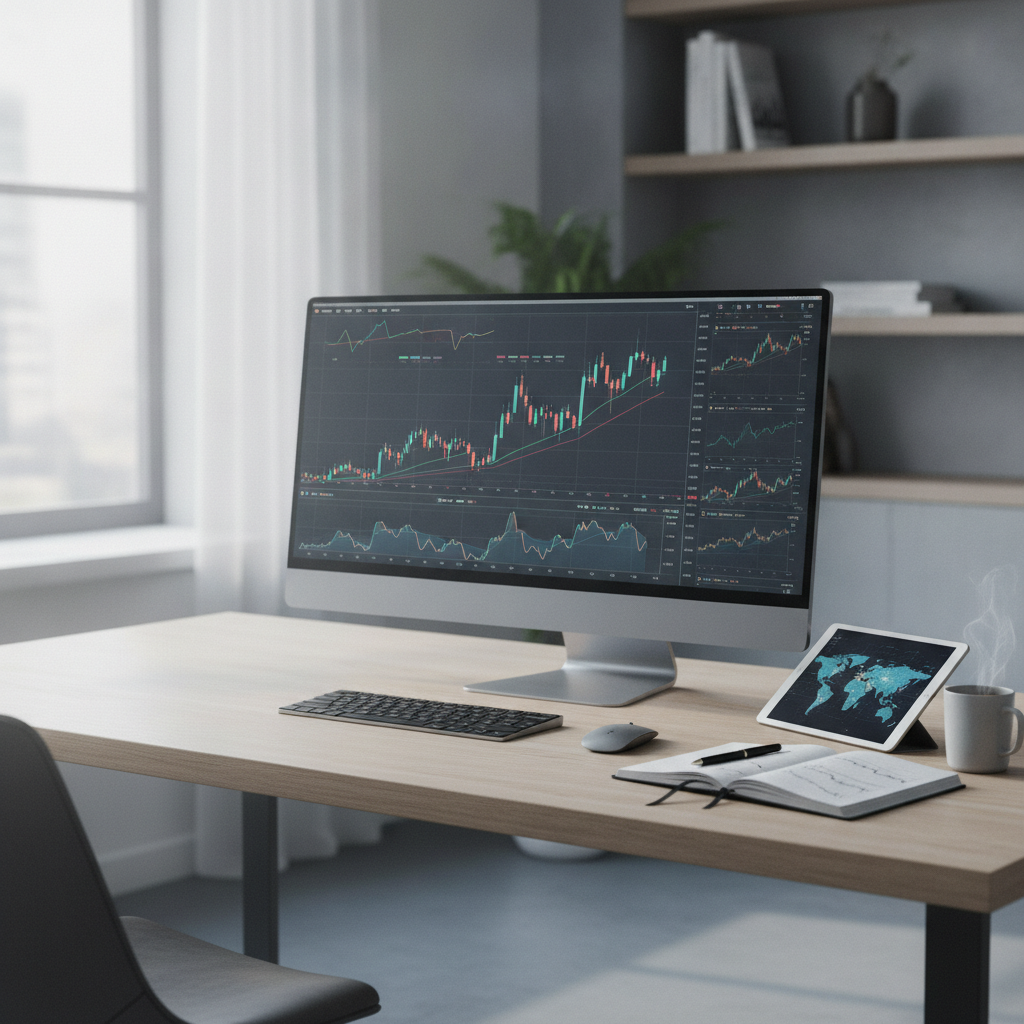
What is technical analysis in trading? In simple terms, it's the practice of studying historical price movement, chart patterns, and trading volume to estimate where a stock, currency, or commodity is most likely headed next — rather than analyzing a company's earnings, revenue, or balance sheet. For beginners trying to understand what is technical analysis in trading, the core idea is that market data itself, particularly price and volume, contains the clues traders need to time their entries and exits.
TL;DR — The Bottom Line
Technical analysis in trading is the study of price charts, volume, and historical patterns to forecast likely future price movement. It relies on tools like moving averages, RSI, MACD, trend lines, and support/resistance levels, and it's built on three core assumptions: price discounts everything, prices move in trends, and history tends to repeat. Beginners typically use it to time entries, exits, and stop-losses — often alongside fundamental analysis rather than instead of it.
What Is Technical Analysis in Trading? A Core Definition
When traders ask what is technical analysis in trading, they're really asking how to read a chart and turn it into a decision. Unlike fundamental analysis, which examines a company's financial health, technical analysis focuses almost entirely on price action and volume. The underlying belief is that all known information — earnings, news, sentiment, macroeconomic data — is already reflected in the current price, so studying the price itself is the most efficient way to make trading decisions.
Technical analysts, sometimes called chartists, use visual tools like candlestick charts, trend lines, and indicators to interpret what the market is "telling" them. This is why so many beginner guides describe technical analysis as a way of reading market psychology — the collective fear, greed, and momentum of buyers and sellers — rather than a company's balance sheet.
Quick Facts
- Core inputs: Price and trading volume
- Common timeframes: Intraday charts for day trading; daily/weekly charts for swing and position trading
- Popular indicators: Moving averages, RSI, MACD, volume, support/resistance
- Most-cited moving averages: 50-day and 200-day
- Primary users: Day traders, swing traders, and longer-term investors combining it with fundamentals
- Core assumption: Price already reflects all available information
The Core Assumptions Behind Technical Analysis
To really understand what is technical analysis in trading, you need to understand the three assumptions almost every technical trader accepts, whether they realize it or not:
- The market discounts everything. Technical analysts assume that a stock's current price already reflects all publicly available information — news, earnings, sentiment, and even rumors — so there's no need to reanalyze the underlying business.
- Prices move in trends. Once a trend forms — up, down, or sideways — it tends to persist until something changes the underlying supply-demand balance. This is why so much technical analysis is dedicated to trend identification.
- History tends to repeat itself. Because trader psychology doesn't change much over time, similar chart patterns (like double tops or head-and-shoulders formations) tend to produce similar outcomes, even across different markets and decades.
These three pillars are why technical analysis in trading is often described as a decision-support framework rather than a crystal ball. It doesn't promise certainty — it estimates probability based on repeatable patterns of human behavior.
No. Technical analysis estimates the most probable direction of price based on historical patterns and current momentum — it does not guarantee outcomes. Most professional traders treat it as a probability tool, always paired with risk management like stop-losses.
Key Tools and Indicators Used in Technical Analysis
If you're still working out what is technical analysis in trading in practice, the fastest way to understand it is through its toolkit. These are the building blocks nearly every technical trader learns first:
Trend Lines and Moving Averages
Trend lines connect a series of highs or lows to visualize direction, while moving averages (commonly the 50-day and 200-day) smooth out price noise to reveal the underlying trend. When a shorter moving average crosses above a longer one, it's often read as a bullish signal — and vice versa.
Support and Resistance
Support is a price level where buying pressure has historically stepped in, while resistance is where selling pressure has capped price gains. These zones help traders identify likely reaction points and set logical stop-loss levels.
Momentum Indicators: RSI and MACD
The Relative Strength Index (RSI) measures whether a stock is overbought or oversold, typically on a 0–100 scale, while the Moving Average Convergence Divergence (MACD) tracks the relationship between two moving averages to signal shifts in momentum.
Candlestick Patterns and Volume
Candlestick charts display open, high, low, and close prices in a single visual, making it easier to spot reversal patterns like hammers or engulfing candles. Volume confirms the strength behind a move — a breakout on high volume is generally considered more reliable than one on light volume.
How to Apply Technical Analysis Step by Step
Understanding what is technical analysis in trading conceptually is one thing — applying it is another. Here's a simplified process beginners commonly follow:
- Choose your timeframe. Day traders typically use 1-minute to 15-minute charts, while swing traders often use daily or weekly charts.
- Identify the trend. Use the 50-day and 200-day moving averages to determine whether the market is in an uptrend, downtrend, or range.
- Mark support and resistance. Draw horizontal lines at recent swing highs and lows to define reaction zones.
- Check momentum. Use RSI or MACD to see whether the trend has strength or is losing steam.
- Confirm with volume. A breakout or breakdown backed by strong volume is generally more trustworthy than one on thin trading.
- Set entry, stop-loss, and target. Combine your signals into a plan with a defined risk-reward ratio before placing a trade.
This process is exactly why many investors use a stock screener alongside their charts — narrowing thousands of tickers down to the handful that meet specific technical conditions, like a moving average crossover or an RSI reading below 30, saves enormous time. Tools like Finviz are built for this kind of technical screening and visual chart review in one place.
Technical Analysis vs. Fundamental Analysis
One of the most common questions after learning what is technical analysis in trading is how it differs from fundamental analysis. The two approaches answer different questions:
| Factor | Technical Analysis | Fundamental Analysis |
|---|---|---|
| Main focus | Price, volume, chart patterns | Earnings, revenue, valuation, industry health |
| Time horizon | Short to medium-term (minutes to months) | Medium to long-term (months to years) |
| Key question | "When should I enter or exit?" | "Is this company worth owning?" |
| Common tools | Moving averages, RSI, MACD, candlesticks | P/E ratio, EPS growth, debt-to-equity, cash flow |
| Typical user | Day traders, swing traders | Long-term investors, value investors |
In practice, many successful investors blend both. They might use fundamental analysis to decide what to buy and technical analysis to decide when to buy it — a workflow that pairs a fundamentals-based stock screener with a technical chart review before pulling the trigger.
Rarely. Most professional and institutional traders combine technical analysis with fundamental research, macroeconomic context, and risk management rules. Technical analysis is typically used for timing, not as a standalone investment thesis.
Common Mistakes Beginners Make With Technical Analysis
Learning what is technical analysis in trading is easy; applying it well takes practice. Beginners commonly run into these pitfalls:
- Overloading charts with indicators. Stacking five or six indicators on one chart often creates conflicting signals rather than clarity. Most experienced traders use two or three complementary tools.
- Ignoring volume. A price breakout without volume confirmation is far more likely to fail or reverse.
- Chasing patterns after they've already played out. By the time a pattern is obvious to everyone, much of the move may already be priced in.
- Skipping a trading plan. Entering a trade without a predefined stop-loss and target turns a calculated decision into a gamble.
- Treating technical analysis as infallible. Patterns fail regularly; risk management is what separates consistent traders from the rest.
According to widely cited trading education resources such as Investopedia's technical analysis library, the discipline works best when paired with clear risk controls rather than used as a standalone predictive system.
Using Finviz for Technical Analysis Screening
For investors who understand what is technical analysis in trading but want to apply it efficiently across thousands of stocks, a screener is essential. Instead of manually checking charts one by one, platforms built for technical analysis allow you to filter the market by moving average crossovers, RSI levels, candlestick patterns, price performance, and volume spikes simultaneously.
Finviz is widely used for exactly this purpose — combining a visual, color-coded market map with a technical screener so traders can go from "what is technical analysis in trading" theory to a practical, filtered watchlist in minutes. This kind of tool doesn't replace learning the fundamentals of chart reading, but it dramatically speeds up the process of finding candidates that already match your technical criteria.
Whether you're a day trader scanning for intraday breakouts or a swing trader looking for stocks bouncing off their 50-day moving average, screening tools narrow the universe of possibilities so your chart analysis time is spent on the highest-probability setups.
Frequently Asked Questions
What is technical analysis in trading, in one sentence?
Technical analysis in trading is the study of historical price, volume, and chart patterns to estimate the most probable future price direction of a security.
Is technical analysis reliable for beginners?
Technical analysis can be a useful framework for beginners, but it is not a guarantee. It works best when combined with a clear trading plan, disciplined risk management, and realistic expectations about probability rather than certainty.
What is the difference between technical analysis and chart patterns?
Chart patterns are one component within the broader field of technical analysis. Technical analysis also includes indicators like RSI and MACD, volume analysis, moving averages, and trend identification, in addition to visual pattern recognition.
Can technical analysis be used for long-term investing?
Yes. While it's most closely associated with day trading and swing trading, longer-term investors often use technical analysis to time entry and exit points around fundamentally sound companies, especially using weekly or monthly charts.
What tools do I need to start with technical analysis?
At minimum, you need a charting platform with price history, volume data, and basic indicators like moving averages, RSI, and MACD. Many beginners also use a stock screener to filter for stocks meeting specific technical conditions before analyzing individual charts.
Conclusion: Putting Technical Analysis Into Practice
So, what is technical analysis in trading, really? It's a practical, price-and-volume-based method for estimating where a market is likely headed next, built on the assumptions that price reflects all available information, that trends persist, and that history tends to repeat through recurring trader behavior. For beginners, the path forward is straightforward: learn to read trend, support, resistance, and momentum, confirm your signals with volume, and always trade with a defined plan.
The traders who get the most out of technical analysis in trading are rarely the ones chasing every indicator — they're the ones who master a few tools deeply and apply them consistently. If you're ready to move from theory to practice, explore Finviz to screen stocks by technical criteria, review charts, and build your own disciplined trading process today.