What Are ETF Screeners? A 2026 Investor's Guide
July 11, 2026 · 14 min read
If you have ever tried to pick an ETF from a universe of more than 3,000 US-listed funds, you already understand the problem: manual browsing does not scale. That is exactly the gap ETF screeners fill. So what are ETF screeners, and why have they become a core part of every serious investor's toolkit in 2026?
TL;DR — The Bottom Line
ETF screeners are filtering tools that let investors narrow the entire exchange-traded fund universe down to a handful of candidates using criteria like expense ratio, assets under management, sector, holdings, performance, and liquidity. In 2026, platforms like Finviz combine visual heatmaps, fundamental and technical filters, and full holdings data (on Elite) so investors can go from broad idea to trade-ready shortlist in minutes rather than hours.
Quick Facts
- Core function: Filter thousands of ETFs by fundamental and technical criteria
- Finviz Elite price: $39.50/month or $299.50/year with a 7-day free trial
- Free tier data: Delayed quotes, typically 15–20 minutes
- Markets covered on Finviz: NYSE, Nasdaq, and Amex
- Elite ETF features: Real-time quotes, full holdings data, ETF & fundamental data, export/API access
- Visual tools: Heatmaps, tree maps, and an interactive ETF map
What Are ETF Screeners, Exactly?
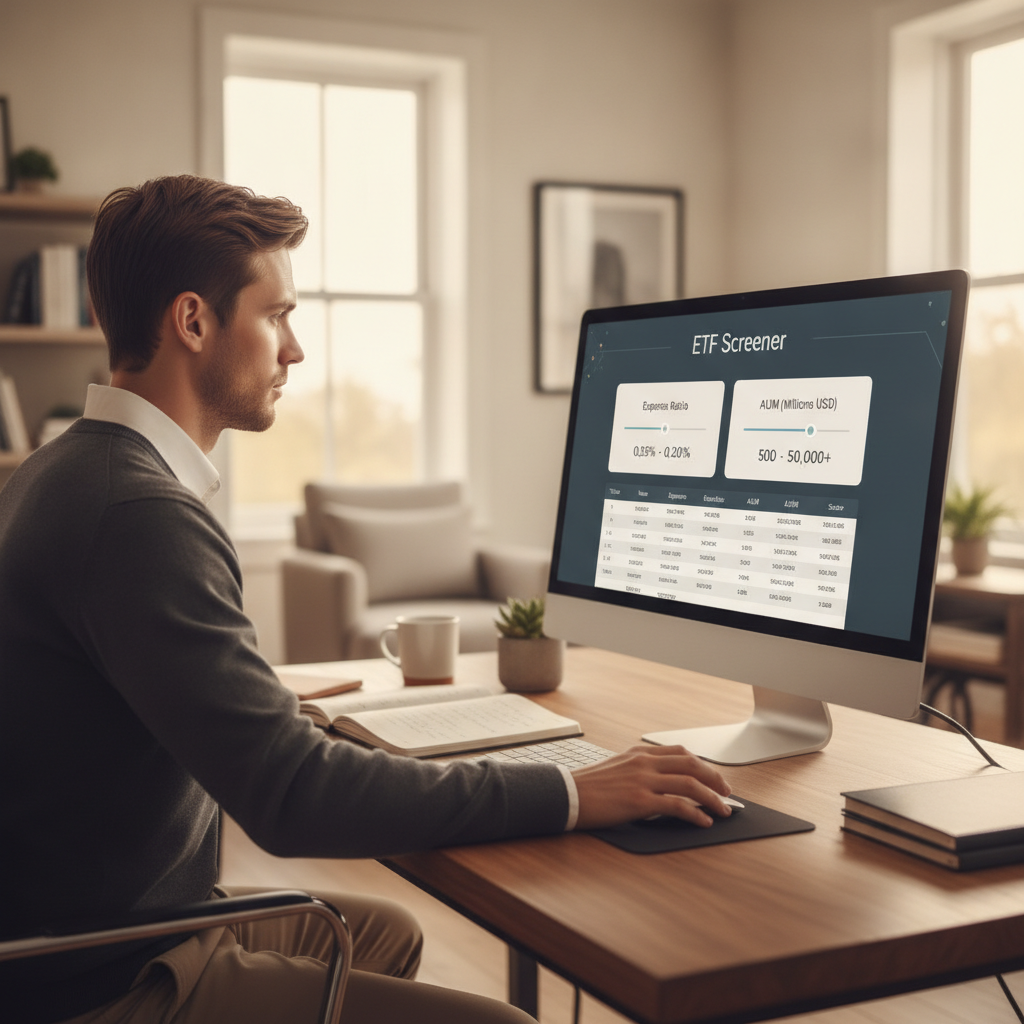
To answer what are ETF screeners in one line: they are search engines for exchange-traded funds. Instead of typing keywords, you set numerical and categorical filters — expense ratio below 0.20%, AUM above $500 million, technology sector, US-focused — and the screener instantly returns every ETF that matches.
Historically, this kind of filtering was reserved for institutional analysts with Bloomberg or FactSet terminals. Today, retail platforms like Finviz, Stock Rover, TradingView, and Koyfin have democratized the workflow. The result is that a self-directed investor can now perform ETF due diligence with roughly the same rigor as a junior analyst at an asset manager.
The reason ETF screeners matter more in 2026 than they did five years ago is simple: the ETF universe keeps expanding. There are thousands of US-listed ETFs now, spanning everything from broad index funds to single-stock leveraged products, thematic AI baskets, and actively managed bond ladders. Without a screener, choosing between them becomes a coin flip.
Why Investors and Traders Rely on ETF Screeners
Understanding what are ETF screeners is only useful once you see what they replace. Before screeners, investors either relied on fund company marketing, financial media "top 10" lists, or hours of manual spreadsheet work. Screeners collapse all of that into a single query.
Here is the practical value they deliver:
- Speed: Cut a 3,000-ETF universe to 15 candidates in under a minute.
- Objectivity: Filters are numerical, so results are not biased by marketing or brand recognition.
- Strategy alignment: Screens can be built around a specific thesis — say, low-fee dividend ETFs with AUM over $1 billion.
- Risk control: Liquidity filters (average daily volume, bid-ask spread) reduce the risk of getting stuck in thinly traded funds.
- Discovery: Visual tools like Finviz's ETF map surface funds you did not know existed.
No. ETF screeners are used by long-term investors, financial advisors, and active traders alike. A retiree using a screener to find a low-cost dividend ETF gets just as much value as a swing trader scanning for high-volume sector funds.
The Core Filters Every ETF Screener Should Offer
Not all screeners are created equal, but the strong ones share a common set of filters. When evaluating what are ETF screeners worth using, look for coverage across these categories:
Fundamental Filters
- Expense ratio: The annual fee, usually 0.03%–1.00%.
- Assets under management (AUM): A proxy for fund viability. Under $50 million and closure risk rises.
- Dividend yield: Trailing or forward yield.
- Inception date: How long the fund has existed.
- Issuer: BlackRock (iShares), Vanguard, State Street (SPDR), Invesco, Schwab, and others.
Composition Filters
- Asset class: Equity, fixed income, commodity, currency, multi-asset.
- Sector and industry exposure
- Geography: US, developed international, emerging markets, single country.
- Holdings: Full constituent list and weights (a premium feature on Finviz Elite).
- Leverage and inverse structure: 1x, 2x, 3x, or short exposure.
Performance and Technical Filters
- Return over 1 month, 3 months, YTD, 1 year, 3 years, 5 years
- Volatility and beta
- Relative strength, moving averages, RSI
- Net fund flows — a Finviz-supported filter that tracks whether money is entering or leaving the fund.
Liquidity Filters
- Average daily volume
- Bid-ask spread
- Shares outstanding
The best ETF screeners in 2026 do not just show you what performed well — they show you what an ETF actually owns, how liquid it is, and where money is flowing.
How Finviz Approaches ETF Screening in 2026
Finviz is best known as a stock screener, but its ETF functionality has quietly become one of the most efficient ways to research funds. The platform integrates ETFs into its broader screener and adds a dedicated ETF map for visual discovery.
On the free tier, users get access to basic ETF filters, delayed quotes (typically 15–20 minutes), and the visual heatmap. That alone is enough for casual research. But the more powerful workflow lives inside Finviz Elite, which unlocks:
- Real-time quotes and charts — essential for traders reacting to intraday moves.
- Full holdings data — see exactly what each ETF owns and in what weight.
- ETF and fundamental data expansion — deeper metrics beyond price.
- Advanced screening, export, and API access — for building repeatable research workflows.
- Custom alerts — get notified when a screened ETF triggers a technical or fundamental condition.
Pricing sits at $39.50/month or $299.50/year, with a 7-day free trial. For an investor running weekly ETF scans, that math typically pays for itself the first time it prevents a bad entry into an illiquid fund.
How to Use an ETF Screener: A Step-by-Step Workflow
Knowing what are ETF screeners is one thing. Using one effectively is another. Here is a repeatable workflow that works whether you are building a long-term portfolio or scanning for a swing trade.
- Define your thesis first. Are you looking for a low-cost core holding? A tactical sector bet? A hedge? The screener follows the thesis, not the other way around.
- Set structural filters. Start with asset class, geography, and issuer. This eliminates 80% of the universe immediately.
- Layer in cost and size filters. Expense ratio caps and AUM minimums remove marginal funds. A common baseline: expense ratio < 0.50%, AUM > $100 million.
- Add liquidity guardrails. Average daily volume above 100,000 shares and tight bid-ask spreads protect execution quality.
- Apply strategy-specific filters. For a momentum thesis, filter by 3-month return above a benchmark. For income, filter by dividend yield.
- Review holdings. This is where Finviz Elite's full holdings data matters. Two ETFs with similar names can own dramatically different underlying securities.
- Cross-check with the visual map. Confirm the shortlisted funds line up with the sector or theme you are targeting.
- Set alerts and monitor. The screen is not a one-off — save it, re-run it monthly, and let alerts flag changes.
For long-term core holdings, quarterly is enough. For tactical or sector-rotation strategies, monthly or even weekly makes sense. Traders using flow-based or technical screens often re-run daily.
ETF Screeners vs. Stock Screeners: What's Different?
Both tools filter securities, but the criteria diverge in important ways.
| Dimension | Stock Screener | ETF Screener |
|---|---|---|
| Primary metrics | P/E, EPS growth, revenue, margins | Expense ratio, AUM, holdings, fund flows |
| Risk indicators | Debt-to-equity, beta | Concentration, sector exposure, leverage factor |
| Liquidity focus | Share volume | Volume + bid-ask spread + creation/redemption |
| Cost consideration | Trading commissions only | Ongoing expense ratio matters materially |
| Composition view | Single company | Basket of dozens to thousands of holdings |
The core insight: ETF screening is portfolio-level screening. You are not evaluating a single business — you are evaluating a curated basket, and the screener needs filters that reflect that.
Comparing the Leading ETF Screeners in 2026
Finviz is not the only game in town. Here is how it stacks up against the main alternatives investors evaluate.
| Platform | Best For | ETF Strength | Notable Limitation |
|---|---|---|---|
| Finviz | Fast visual screening + Elite ETF depth | Heatmaps, ETF map, full holdings on Elite, fund flow filters | Free tier uses delayed data |
| Stock Rover | Long-term fundamental research | Deep ETF fundamentals, portfolio integration | Less trader-focused |
| TradingView | Chart-first technical analysis | Real-time filtering, NAV, country filters | Fund composition depth is thinner |
| Koyfin | Ad-free comprehensive research | Full holdings, customizable dashboards | Steeper learning curve |
| Yahoo Finance | Casual free-tier users | Basic filtering, familiar UX | Limited advanced filters |
| ETFDB / TrackInsight | ETF-only specialists | ETF-native databases and comparisons | Isolated from broader stock research |
Finviz's edge is speed and visual discovery inside a generalist platform. If you already scan stocks there, adding ETF workflows means one login, one interface, and one mental model — not three.
Common Myths About ETF Screeners
Advanced Use Cases: Beyond Basic Filtering
Once you are comfortable with the basics of what are ETF screeners, you can push them into more sophisticated territory.
Sector Rotation
Use the Finviz ETF map to spot which sector ETFs are outperforming over a rolling window. Combine with relative strength filters to identify leadership changes early. This is a core workflow for tactical asset allocators.
Flow-Based Momentum
Finviz supports ETF net fund flow filters. Screening for funds with consistent inflows over the past 30 days can surface where institutional money is moving before price fully reflects it.
Thematic Basket Discovery
Filter by holdings to find every ETF that owns a specific company above a certain weight. This is powerful for expressing a thesis on a stock through a diversified vehicle instead of a single-name bet.
Leverage and Inverse Screening
Traders can isolate leveraged and inverse ETFs for short-term tactical trades, filtering out long-duration holdings that suffer from volatility decay.
Dividend Ladders
Long-term investors can screen for dividend ETFs by yield, payout consistency, and issuer, then compare full holdings to avoid overlap across positions.
What to Watch for When Choosing an ETF Screener
Not every screener will fit every investor. Before committing to a paid tier, evaluate these dimensions:
- Data freshness: Real-time vs delayed matters more for traders than long-term investors.
- Holdings depth: Can you see full constituents or only top 10?
- Filter combinability: Can you stack fundamental + technical + flow filters in a single query?
- Visualization: Heatmaps, tree maps, and sector maps speed up decision-making dramatically.
- Export and API: Critical if you build models or dashboards outside the platform.
- Alert system: Screening without alerts is a snapshot. Screening with alerts is a monitoring system.
The Future of ETF Screening
The trajectory is clear. ETF screeners are moving from simple filter interfaces toward portfolio-analytical engines. Expect three shifts to accelerate through 2026 and beyond:
- Deeper holdings analytics. Factor exposure, sector overlap, and concentration risk will become standard fields, not premium extras.
- Real-time flow tracking. Net inflows and outflows will become as visible as price on retail platforms.
- Integrated workflows. The line between screening, charting, and portfolio management will blur — which favors platforms like Finviz that already combine multiple research surfaces.
The investors who adapt fastest will be those who stop thinking of a screener as a search box and start treating it as the front end of their entire research process.
Frequently Asked Questions
What are ETF screeners used for?
ETF screeners are used to filter the entire universe of exchange-traded funds down to a shortlist that matches specific criteria — such as expense ratio, AUM, sector, holdings, performance, and liquidity. They save hours of manual research and let investors align fund choices with a defined strategy.
Is the Finviz ETF screener free?
Finviz offers a free tier with basic ETF filters, delayed quotes (typically 15–20 minutes), and access to the ETF map. Finviz Elite, priced at $39.50/month or $299.50/year, unlocks real-time data, full holdings, advanced screening, exports, and alerts. A 7-day free trial is available.
What is the difference between an ETF screener and a stock screener?
A stock screener filters individual companies by metrics like P/E ratio and EPS growth. An ETF screener filters funds by portfolio-level metrics like expense ratio, AUM, holdings composition, and fund flows. ETF screening is essentially portfolio-level filtering rather than single-security analysis.
Which filters matter most in an ETF screener?
The highest-impact filters are expense ratio, AUM, average daily volume, sector or geography exposure, and — for advanced users — holdings composition and net fund flows. Combining structural, cost, and liquidity filters typically narrows the universe fastest.
Can ETF screeners help me build a long-term portfolio?
Yes. Long-term investors use ETF screeners to identify low-cost core holdings, screen for dividend income, and check holdings overlap between funds. Running the same screen quarterly helps maintain portfolio discipline and catch when a fund drifts from its stated strategy.
Conclusion: Turn Screening Into a Repeatable Edge
The short answer to what are ETF screeners is that they are the single most efficient way to move from a vague investment idea to a concrete list of tradable funds. The longer answer is that in 2026, they have evolved into portfolio-analytical platforms that combine visual discovery, holdings transparency, real-time data, and flow tracking in one workflow.
Whether you are a long-term investor building a low-cost core portfolio or a trader rotating between sector ETFs weekly, the discipline of screening turns market complexity into a repeatable process. And the tools that combine speed, visualization, and depth — like Finviz and its Elite ETF features — are what separate serious research from guesswork.
Ready to see what a modern ETF screener can do? Start with the free tier at Finviz, explore the ETF map, and if the workflow fits, take advantage of the 7-day Elite trial to unlock real-time data and full holdings. Your next ETF decision deserves better than a top-10 list.