Stock Screener for Dividend Stocks: Finviz Guide
June 25, 2026 · 13 min read
TL;DR — The Bottom Line
A stock screener for dividend stocks lets you filter thousands of equities by yield, payout ratio, and quality metrics in seconds. Finviz offers one of the most popular free screeners, letting investors combine dividend yield thresholds (Positive, Over 3%, High >5%, Very High >10%) with fundamentals like ROE, debt-to-equity, and EPS growth to build everything from high-yield income screens to dividend growth portfolios.
Finding reliable income-producing equities used to mean poring over annual reports and dividend histories one ticker at a time. Today, a well-built stock screener for dividend stocks compresses that work into a few clicks—surfacing yield, payout sustainability, and growth quality across thousands of names instantly. For dividend investors who want to combine speed with depth, Finviz has become a default starting point, prized for its free tier, breadth of filters, and clean visual interface.
This guide breaks down exactly how to use a stock screener for dividend stocks like Finviz to build income, dividend growth, and quality-yield portfolios. You'll learn which filters matter, how to layer them for sustainability, where Finviz fits in the competitive landscape, and how to avoid the most common screening mistakes that lead to dividend cuts and disappointing total returns.
Quick Facts
- Platform: Finviz browser-based screener (free + Elite tiers)
- Coverage: U.S. equities on NYSE, NASDAQ, AMEX
- Data delay: 15 minutes on free tier (real-time on Elite)
- Dividend yield filters: Positive, Over 1%, Over 2%, Over 3%, High >5%, Very High >10%
- Payout ratio filter: Available under Fundamental tab
- Highest-yielding sectors (group view): Energy ~3.77%, Real Estate ~3.70%, Consumer Defensive ~2.40%
Why a Stock Screener for Dividend Stocks Matters
There are more than 6,000 publicly listed U.S. companies, and roughly 2,000 of them pay a dividend of some kind. Without a screener, identifying which ones offer sustainable yield at a fair valuation is impractical. A purpose-built stock screener for dividend stocks solves three problems at once: it narrows the universe by yield, validates quality through fundamentals, and surfaces sector-level context so you don't overconcentrate.
Dividend investors typically have one of three goals: maximize current income, capture dividend growth over decades, or balance both with capital appreciation. Each goal requires a different filter stack, and a flexible screener like Finviz's screener lets you save and revisit each one. The result is a repeatable process rather than a hunt for the next hot ticker.
"A screener doesn't pick winners—it eliminates the obvious losers, leaving you a manageable shortlist where real research can begin."
How Finviz Works as a Stock Screener for Dividend Stocks
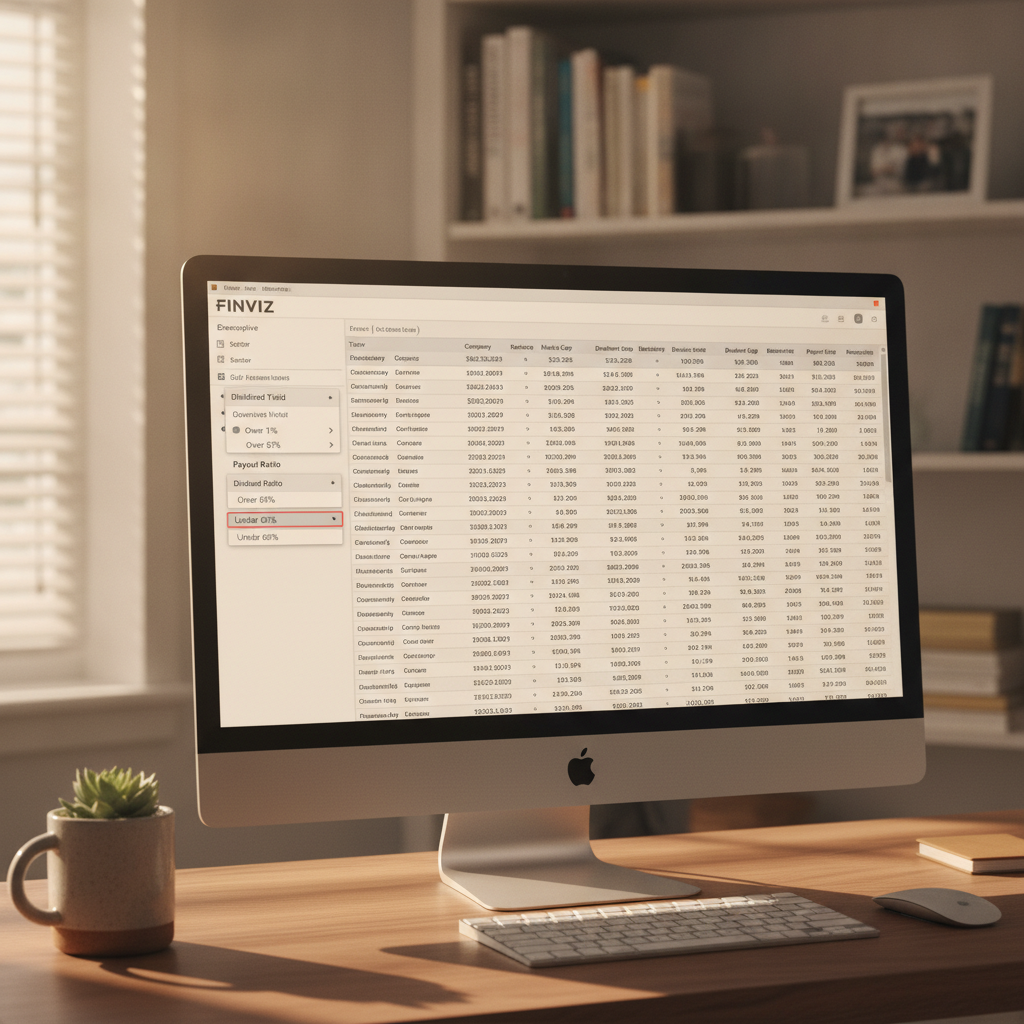
Finviz's screener is organized into three main tabs: Descriptive, Fundamental, and Technical. Dividend investors will spend most of their time in the first two. Inside the Descriptive tab, the Dividend Yield dropdown offers preset bands ranging from "Positive" to "Very High (>10%)"—plus a custom field on the Elite tier. The Fundamental tab is where you layer in the quality filters that separate a sustainable payout from a yield trap.
Unlike research terminals that lock dividend data behind subscriptions, Finviz makes the core income filters available on the free tier. You can sort the results table by yield, payout ratio, P/E, market cap, or performance, then click any ticker for a one-page snapshot with charts, insider activity, and news. That speed is why Finviz consistently shows up in dividend-investor recommendations as a primary stock screener for dividend stocks.
Yes. The free tier includes dividend yield filters, payout ratio, all standard fundamentals, and unlimited screens with 15-minute delayed quotes. The Elite tier ($24.96/month or $299.50/year) adds real-time data, custom numeric filters, backtesting, and advanced charts.
The Core Dividend Filters You Should Always Use
Every effective stock screener for dividend stocks setup rests on two non-negotiable filters: dividend yield and payout ratio. Yield tells you what you're paid; payout ratio tells you whether that pay is sustainable.
Dividend Yield
Yield is the annual dividend divided by the share price. Finviz lets you screen for:
- Positive: any dividend payer—useful for dividend growth screens where you'll layer growth filters on top.
- Over 2% or Over 3%: a moderate income band that captures most blue-chip dividend payers.
- High (>5%): entering high-yield territory—often REITs, BDCs, MLPs, and mature utilities.
- Very High (>10%): usually a warning sign. Yields this elevated typically reflect a falling share price and impending dividend cut.
Payout Ratio
Payout ratio equals dividends paid divided by earnings. A traditional rule of thumb says ratios above 80% are risky for most industries, though REITs and MLPs operate at higher payouts by design. Setting payout ratio to "Under 60%" inside Finviz immediately filters out many fragile high-yielders.
Building Three Proven Screens in Finviz
The power of a stock screener for dividend stocks shows up when you stack filters into a coherent strategy. Below are three battle-tested screens you can replicate inside Finviz in under five minutes each.
Screen 1: High-Yield Income (Retirees, Cash-Flow Focus)
- Dividend Yield: Over 4%
- Payout Ratio: Under 75%
- Market Cap: +Mid (over $2B)
- Debt/Equity: Under 1
- Return on Equity: Over +10%
This combination targets established mid- and large-cap companies that can comfortably fund a meaningful payout. Expect to see utilities, integrated energy, telecoms, and select REITs.
Screen 2: Dividend Growth (Compounders)
- Dividend Yield: Positive (over 1%)
- EPS Growth Past 5 Years: Over 10%
- EPS Growth Next 5 Years: Over 8%
- Payout Ratio: Under 50%
- Return on Equity: Over +15%
- Market Cap: +Large (over $10B)
Lower starting yield, but the strict growth and quality filters surface compounders capable of double-digit dividend hikes for years. This is the classic "chowder rule" style screen popular among long-term investors.
Screen 3: Quality Yield (Balanced)
- Dividend Yield: Over 2.5%
- Payout Ratio: 20% to 60%
- Debt/Equity: Under 0.5
- P/E: Under 20
- Return on Equity: Over +12%
- Index: S&P 500
A defensible middle path: respectable income, reasonable valuation, low leverage, and S&P 500 membership as a basic quality screen. You can save each of these inside your Finviz screener workspace for one-click access.
Using Sector and Group Views for Dividend Context
One feature dividend investors often underuse is Finviz's Group screener, which rolls up metrics by sector, industry, and country. Because aggregate yield varies enormously by sector, this view tells you where the income lives before you ever screen individual tickers.
Recent group-level dividend yields illustrate the dispersion:
| Sector | Approx. Aggregate Dividend Yield |
|---|---|
| Energy | ~3.77% |
| Real Estate | ~3.70% |
| Consumer Defensive | ~2.40% |
| Financials | ~2.0–2.5% |
| Technology | ~0.56% |
If your goal is current income, weighting toward Energy, Real Estate, and Consumer Defensive makes structural sense. If you're a dividend growth investor, lower-yielding sectors like Technology and Industrials may offer faster payout growth from a lower base. The group view turns this from guesswork into data.
Most investors re-run their core screens monthly and after major earnings seasons. Yield bands shift with prices, payout ratios update with new EPS prints, and saved Finviz screens make repeat scans take seconds rather than hours.
How Finviz Compares to Other Dividend Screeners
No single tool dominates every use case. Here's how Finviz stacks up against the most common alternatives when used as a stock screener for dividend stocks:
| Tool | Best For | Free Dividend Filters | Strength vs. Finviz |
|---|---|---|---|
| Finviz | Fast scanning, swing investors, DIY income | Yes (yield + payout ratio) | Speed, visualization, free tier breadth |
| Stock Rover | Deep buy-and-hold dividend research | Limited free | Payout safety scores, dividend history depth |
| TradingView | Chart-driven traders | Yes | Charting and custom scripts |
| Yahoo Finance | Casual investors | Yes (basic) | Familiar UI, broad reach |
| Koyfin | Macro/multi-asset dashboards | Limited | Cross-asset context, modern UI |
| Zacks | Earnings-revision strategies | Yes | Proprietary Zacks Rank |
For most retail dividend investors, the practical workflow is to scan with Finviz, then validate top candidates against dividend history data on a research platform or directly via the company's investor relations page. The point of a screener isn't to make the decision—it's to give you a clean shortlist.
How to Build Your First Dividend Screen: Step-by-Step
Here's a beginner-friendly walkthrough using Finviz as your stock screener for dividend stocks:
- Open the Finviz screener. Navigate to the screener page and select the Fundamental tab so you can see yield, payout ratio, and key ratios in one view.
- Set your dividend yield band. Choose "Over 3%" for income or "Positive" for dividend growth strategies.
- Add a payout ratio filter. Select "Under 60%" (or "Under 75%" if you're including REITs).
- Filter for financial strength. Set Debt/Equity to "Under 1" and Return on Equity to "Over +10%".
- Apply a size or quality gate. Choose Market Cap "+Mid" or restrict to S&P 500 index members.
- Sort the results. Click the Dividend column to rank by yield, or sort by P/E to find value-priced names.
- Save the screen. If you have a Finviz account, save the URL or screen so you can rerun it in one click later.
- Validate before buying. For every shortlisted ticker, verify the dividend history, payout coverage, and ex-dividend dates on the company's investor relations site.
Common Mistakes When Using a Stock Screener for Dividend Stocks
Even experienced investors fall into predictable traps when screening for income. Watch for these:
- Chasing yield without checking payout ratio. A 9% yield with a 110% payout ratio is a dividend cut waiting to happen.
- Ignoring sector concentration. Pure yield screens often surface 80% REITs and utilities, leaving you exposed to interest rate moves.
- Forgetting growth metrics. A stock yielding 3% with no earnings growth will likely deliver a flat real income stream after inflation.
- Skipping debt analysis. High leverage threatens dividends fastest in downturns—always include Debt/Equity in your stock screener for dividend stocks filters.
- Not re-screening. Markets and fundamentals shift. Yields that looked attractive in January may signal trouble by July.
"The best dividend screens combine three layers: a yield that meets your income goal, a payout ratio that protects it, and a balance sheet that survives the next recession."
Going Beyond the Free Tier
The free Finviz screener covers 90% of what most dividend investors need. The Finviz Elite tier becomes worthwhile if you want:
- Real-time quotes instead of 15-minute delays.
- Custom numeric filters (e.g., yield between 3.2% and 4.7%) rather than preset bands.
- Backtesting to see how your dividend screen would have performed historically.
- Advanced charts with technical overlays for timing entries.
- Email and intraday alerts when screen results change.
For active dividend traders building positions weekly, those features pay for themselves quickly. For buy-and-hold income investors who screen monthly, the free tier remains exceptional value.
Frequently Asked Questions
What is the best free stock screener for dividend stocks?
Finviz is widely cited by dividend investors as the best free stock screener for dividend stocks because it includes both dividend yield and payout ratio filters alongside dozens of fundamental and technical criteria, with a fast, visual interface and no usage caps on the free tier.
What dividend yield should I screen for?
It depends on your goal. Income-focused investors typically screen for yields above 3% or 4%, while dividend growth investors often use "Positive" (any yield over ~1%) and layer growth filters on top. Yields above 8–10% should be treated as warning signs unless validated by strong fundamentals.
How do I avoid dividend yield traps with a screener?
Always combine the dividend yield filter with a payout ratio cap (under 60–75%), a debt-to-equity limit, and a profitability metric like ROE. This three-layer approach inside any stock screener for dividend stocks filters out most companies likely to cut their payouts.
Can Finviz screen for dividend growth history?
The free tier doesn't include a dedicated "years of dividend growth" filter, but you can approximate dividend growth quality by combining "Dividend Yield: Positive" with strong EPS growth filters (Past 5 Years and Next 5 Years) and a low payout ratio. Elite users can build more precise custom screens.
How often should I update my dividend screen?
Most investors re-run their core screens monthly and immediately after earnings season, when payout ratios, EPS growth, and yield bands shift. Saving your screen in Finviz makes monthly updates a one-click task.
Conclusion: Turn Screening Into a Repeatable Edge
A great stock screener for dividend stocks doesn't tell you what to buy—it gives you a clean, filtered shortlist where real research can begin. By combining yield, payout ratio, debt, and growth filters inside Finviz, you transform dividend investing from a hunt for tips into a disciplined, repeatable process. Whether you're chasing 5% yields for retirement income or compounding 1.5% yields with double-digit dividend growth, the underlying workflow is the same: screen, validate, monitor, repeat.
Ready to build your own income shortlist? Open the Finviz screener, choose your dividend yield band, layer in payout ratio and quality filters, and save the screen. Five minutes of setup will save you hundreds of hours of research—and may meaningfully improve the durability of your dividend income for years to come.