How to Screen for Penny Stocks: Strategies and Tools
August 8, 2026 · 13 min read

Knowing how to screen for penny stocks is the difference between finding a liquid, tradeable opportunity and getting stuck in a thinly traded name you can't exit. With thousands of low-priced securities trading across NASDAQ, NYSE, and OTC markets, a disciplined screening process is not optional — it's the foundation of any penny-stock strategy. This guide walks through the exact filters, workflows, and tools professional and retail traders use to screen for penny stocks efficiently, using Finviz as the primary example.
TL;DR — The Bottom Line
To screen for penny stocks effectively, start with a price filter under $5, restrict results to major exchanges like NASDAQ and NYSE, and require average volume above 500K to 1M shares for liquidity. Layer on relative volume above 1–2 to catch unusual activity, keep shares outstanding under roughly 100 million to target a manageable float, and finish with momentum filters to separate strong setups from weak, stagnant names. Finviz's free screener supports every one of these filters in a single, fast workflow, making it a practical starting point for anyone learning how to screen for penny stocks.
Quick Facts
- Typical penny-stock price range: Under $5 per share
- Recommended minimum average volume: 500K–1M shares daily
- Relative volume threshold for unusual activity: 1.0–2.0 or higher
- Common shares-outstanding cap: Under 100 million
- Preferred exchanges: NASDAQ, NYSE, AMEX over OTC
- Primary free tool used in this guide: Finviz stock screener
What Is a Penny Stock, and Why Screening Matters
A penny stock is generally defined as a share trading below $5, though the U.S. Securities and Exchange Commission's traditional definition covers securities under $5 that often trade outside major national exchanges. The appeal is obvious: low dollar prices mean traders can control large share counts with modest capital, and even small price moves can translate into outsized percentage gains. The risk is just as real — many penny stocks trade with wide spreads, low volume, and minimal public information, which is exactly why learning how to screen for penny stocks properly matters more than chasing any single cheap ticker.
Without a structured screen, traders end up scrolling through hundreds of illiquid names with no way to distinguish a stock that's building real momentum from one that simply hasn't moved in months. A good screening process filters out the noise and surfaces a shortlist worth researching further.
How to Screen for Penny Stocks Step by Step
The core workflow for how to screen for penny stocks on a platform like Finviz follows a repeatable sequence. Rather than guessing at filters, work through them in order of importance: universe, liquidity, activity, size, and momentum.
- Set the price filter. In Finviz's screener, open the Descriptive tab and set Price to "Under $5." This immediately narrows the universe from thousands of tickers to a focused penny-stock list.
- Restrict the exchange. Limit results to NASDAQ, NYSE, and AMEX. Excluding OTC and pink-sheet listings removes many of the least liquid, least transparent names from the results.
- Require average volume. Set Average Volume to "Over 500K" as a baseline, or "Over 1M" if you trade more aggressively and need tighter spreads and easier fills.
- Add relative volume. Under the Technical tab, set Relative Volume to "Over 1" or higher to flag stocks trading more actively than their own recent average — a strong signal that something is happening today.
- Cap shares outstanding. Setting Shares Outstanding to "Under 100M" acts as a rough float proxy, helping surface names that can move faster on comparatively lower buying pressure.
- Layer in momentum. Add a Performance filter such as "Month Up" or "Quarter Up" to separate stocks showing real strength from those that are simply cheap and flat.
- Review and sort. Sort the resulting list by volume, relative volume, or performance, then move to manual review of news, float, and chart structure before considering any trade.
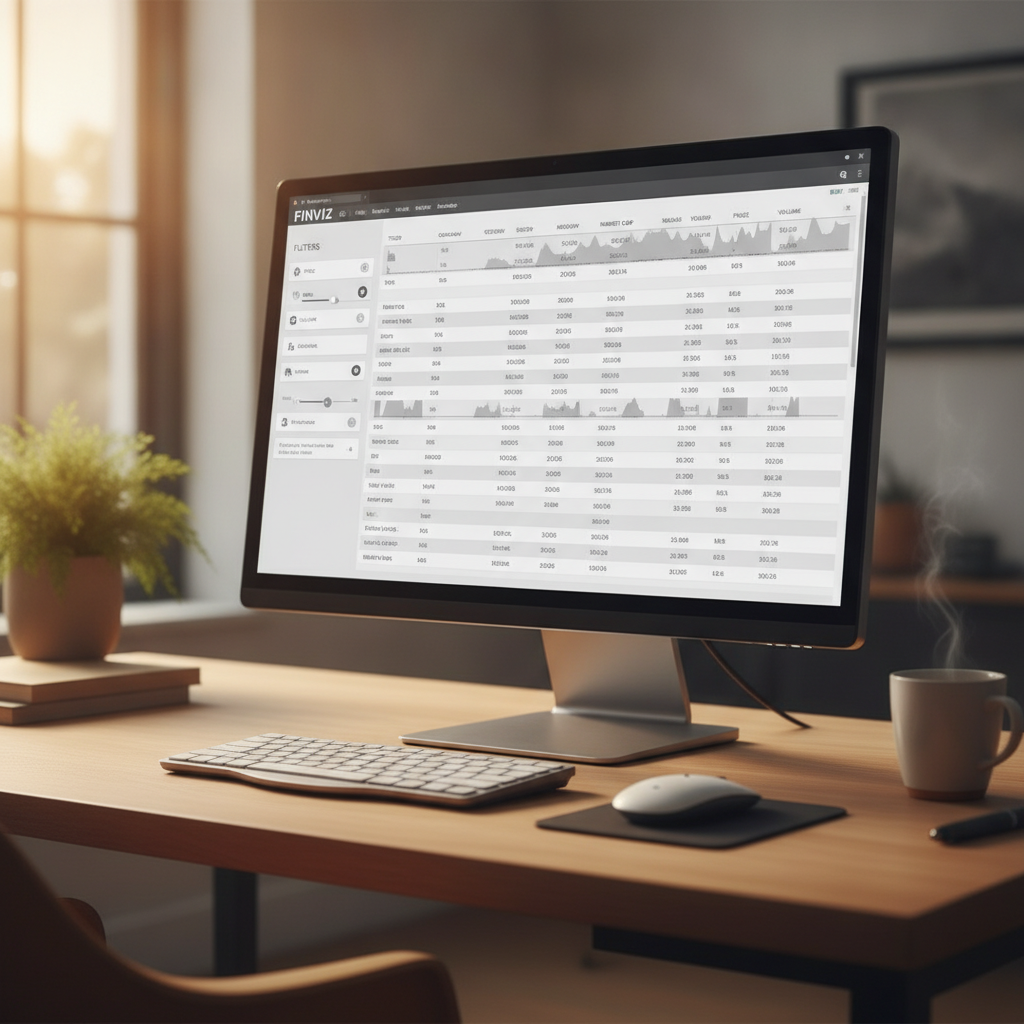
Start broad with price and exchange filters, then tighten with volume and relative volume. Applying too many restrictive filters at once (price, volume, float, momentum, and sector) simultaneously can eliminate perfectly tradeable stocks. Add filters one at a time and watch how the result count changes.
Core Filters: Price, Volume, and Exchange
These three filters form the backbone of any effective approach to how to screen for penny stocks, because they control the universe you're working with before any technical analysis begins.
Price
Most tutorials and professional traders define penny stocks as anything priced under $5, though some tighten this to under $2 or even under $1 for more aggressive strategies. Setting the ceiling too high (say, under $10) blends penny stocks with small-cap stocks that behave very differently in terms of volatility and volume patterns.
Volume
Average daily volume is arguably the single most important liquidity filter. A stock priced at $2 with only 50,000 shares traded per day can have spreads wide enough to erase any theoretical profit before a position is even closed. Requiring average volume over 500K, and ideally over 1M for active trading, filters out names that look interesting on a chart but are effectively untradeable at size.
Exchange
Restricting results to NASDAQ, NYSE, and AMEX listings over OTC markets generally improves data quality, reporting standards, and liquidity. OTC-listed penny stocks can still offer opportunities, but they require significantly more manual due diligence, so most systematic screens default to major exchanges first.
Not by default. OTC listings often have looser reporting requirements and thinner liquidity. Most traders who screen for penny stocks start with NASDAQ and NYSE names and only branch into OTC territory after building experience and adding extra due diligence steps.
Relative Volume and Float: Finding Active, Tradeable Penny Stocks
Price and average volume tell you what's historically tradeable; relative volume and float tell you what's happening right now. This distinction is central to any modern approach to how to screen for penny stocks, because static filters alone can't identify which stocks are attracting fresh attention today.
Relative Volume
Relative volume compares a stock's current trading volume to its typical average at the same point in the trading day. A reading above 1.0 means the stock is trading more actively than usual; readings of 2.0, 5.0, or higher often accompany news catalysts, earnings surprises, or social-media-driven attention. Screening for relative volume over 1.5–2 is a common way to surface penny stocks worth investigating on any given day.
Float and Shares Outstanding
Float refers to the number of shares actually available for public trading, excluding restricted or closely held shares. A low float combined with rising volume can produce sharp, fast price moves — which is part of the appeal (and the risk) of penny-stock trading. Since exact float data isn't always available, many traders use shares outstanding under 100 million as a workable proxy when they screen for penny stocks.
| Filter | Conservative Setting | Aggressive Setting |
|---|---|---|
| Price | Under $5 | Under $2 |
| Average Volume | Over 500K | Over 1M |
| Relative Volume | Over 1.0 | Over 2.0 |
| Shares Outstanding | Under 100M | Under 50M |
Adding Momentum and Technical Filters
Once liquidity and float filters are in place, the next step in how to screen for penny stocks is layering in momentum and technical criteria to separate genuinely strong setups from stocks that are cheap simply because demand has dried up.
Useful additions include:
- Performance filters such as "Up" on the week, month, or quarter, which highlight stocks already in an uptrend rather than ones drifting lower.
- Price relative to moving averages, favoring stocks trading above their 20-day or 50-day simple moving average as a basic trend confirmation.
- 52-week high/low proximity, which can flag breakout candidates near new highs or potential reversal plays near lows.
- Candlestick or chart pattern filters, useful for traders who want to combine screening with basic technical setups before committing capital.
Combining these with the liquidity filters above transforms a simple price screen into a genuinely actionable watchlist — this layered approach is what most current 2026-era tutorials mean when they describe how to screen for penny stocks the right way, rather than relying on price alone.
Finviz vs. Other Tools for Penny Stock Screening
Finviz isn't the only platform capable of penny-stock screening, but its combination of speed, free access, and filter depth makes it a common starting point. Understanding how it compares to other tools helps clarify when it's the right fit.
| Tool | Best For | Penny-Stock Fit |
|---|---|---|
| Finviz | Fast, free multi-filter screening | Strong — quick price/volume/float/momentum combos |
| TradingView | Global charting and screening | Good, with broader international coverage |
| TC2000 | High-speed technical scanning | Good for traders wanting live scan alerts |
| Stock Rover | Fundamental research | Weaker fit — most penny stocks lack deep fundamentals |
| Barchart | Multi-asset market data | Moderate, decent free screening tools |
According to Investopedia's broker and tool comparisons, Finviz is frequently ranked as a top choice specifically for swing traders who need fast, practical filtering rather than a full institutional research terminal — a positioning that lines up closely with how traders actually screen for penny stocks in practice. You can explore the current filter set directly on the Finviz homepage.
Common Mistakes to Avoid When You Screen for Penny Stocks
Even with the right filters, mistakes in execution can undermine an otherwise solid approach to how to screen for penny stocks.
- Ignoring liquidity entirely. A stock that looks great on a chart is worthless if you can't fill an order without significant slippage.
- Over-filtering. Stacking too many narrow criteria at once can shrink results to zero and hide legitimate opportunities.
- Skipping manual review. Screeners generate candidates, not final trade decisions — always check recent news, share structure, and dilution risk before acting.
- Chasing relative volume spikes blindly. High relative volume without understanding the underlying catalyst can lead to buying into a pump that's already fading.
- Treating price as the only criterion. As covered earlier, price under $5 is just the entry point, not the whole strategy.
Building a Repeatable Penny Stock Screening Routine
Consistency matters more than any single clever filter combination. Traders who consistently succeed at how to screen for penny stocks typically run the same core scan daily or intraday, then apply a lightweight manual checklist before adding anything to a watchlist.
A practical daily routine looks like this:
- Run the base screen (price under $5, major exchanges, average volume over 500K).
- Sort by relative volume to find today's most active names.
- Cross-check shares outstanding and recent news for each candidate.
- Pull up a chart to confirm trend direction and recent price structure.
- Add only the strongest two or three setups to an active watchlist.
This kind of repeatable process is what separates traders who treat penny-stock screening as a discipline from those who treat it as guesswork.
Frequently Asked Questions
What is the best way to learn how to screen for penny stocks?
Start with a free tool like Finviz and practice building a simple screen: price under $5, major exchanges only, and average volume over 500K. Gradually add relative volume, float, and momentum filters as you get comfortable interpreting the results.
What price range defines a penny stock?
Most traders and screeners define penny stocks as shares trading under $5, though some narrow this further to under $2 or even under $1 for more aggressive strategies.
How much trading volume should a penny stock have?
A common minimum is average volume over 500,000 shares daily, with many active traders preferring 1 million or more to ensure reasonable spreads and easier order execution.
Is Finviz good for screening penny stocks specifically?
Yes. Finviz's free screener supports price, volume, exchange, relative volume, shares outstanding, and performance filters in one interface, which covers the core criteria most traders use to screen for penny stocks.
Should I avoid OTC-listed penny stocks?
Not necessarily, but OTC stocks generally carry lower liquidity and looser reporting standards than NASDAQ or NYSE listings. Most screening workflows start with major exchanges and treat OTC names as a separate, higher-diligence category.
Final Thoughts on Screening for Penny Stocks
Mastering how to screen for penny stocks isn't about finding a single magic filter — it's about layering price, liquidity, activity, float, and momentum into a repeatable process that consistently surfaces tradeable candidates instead of illiquid noise. Tools like Finviz make this workflow accessible for free, letting traders combine multiple filters in seconds rather than manually scanning exchange listings. The traders who succeed long-term treat screening as the first step of research, not the last — always following up with manual review of news, chart structure, and share dilution risk before committing capital.
Ready to put this into practice? Head to the Finviz screener and build your first price-under-$5, volume-over-500K scan today, then start layering in relative volume and momentum filters to refine your penny-stock watchlist.